Chart Vizzard
Vizzlos KI-basierter Diagramm-GeneratorUS Annual Inflation & Russian Invasion of Ukraine
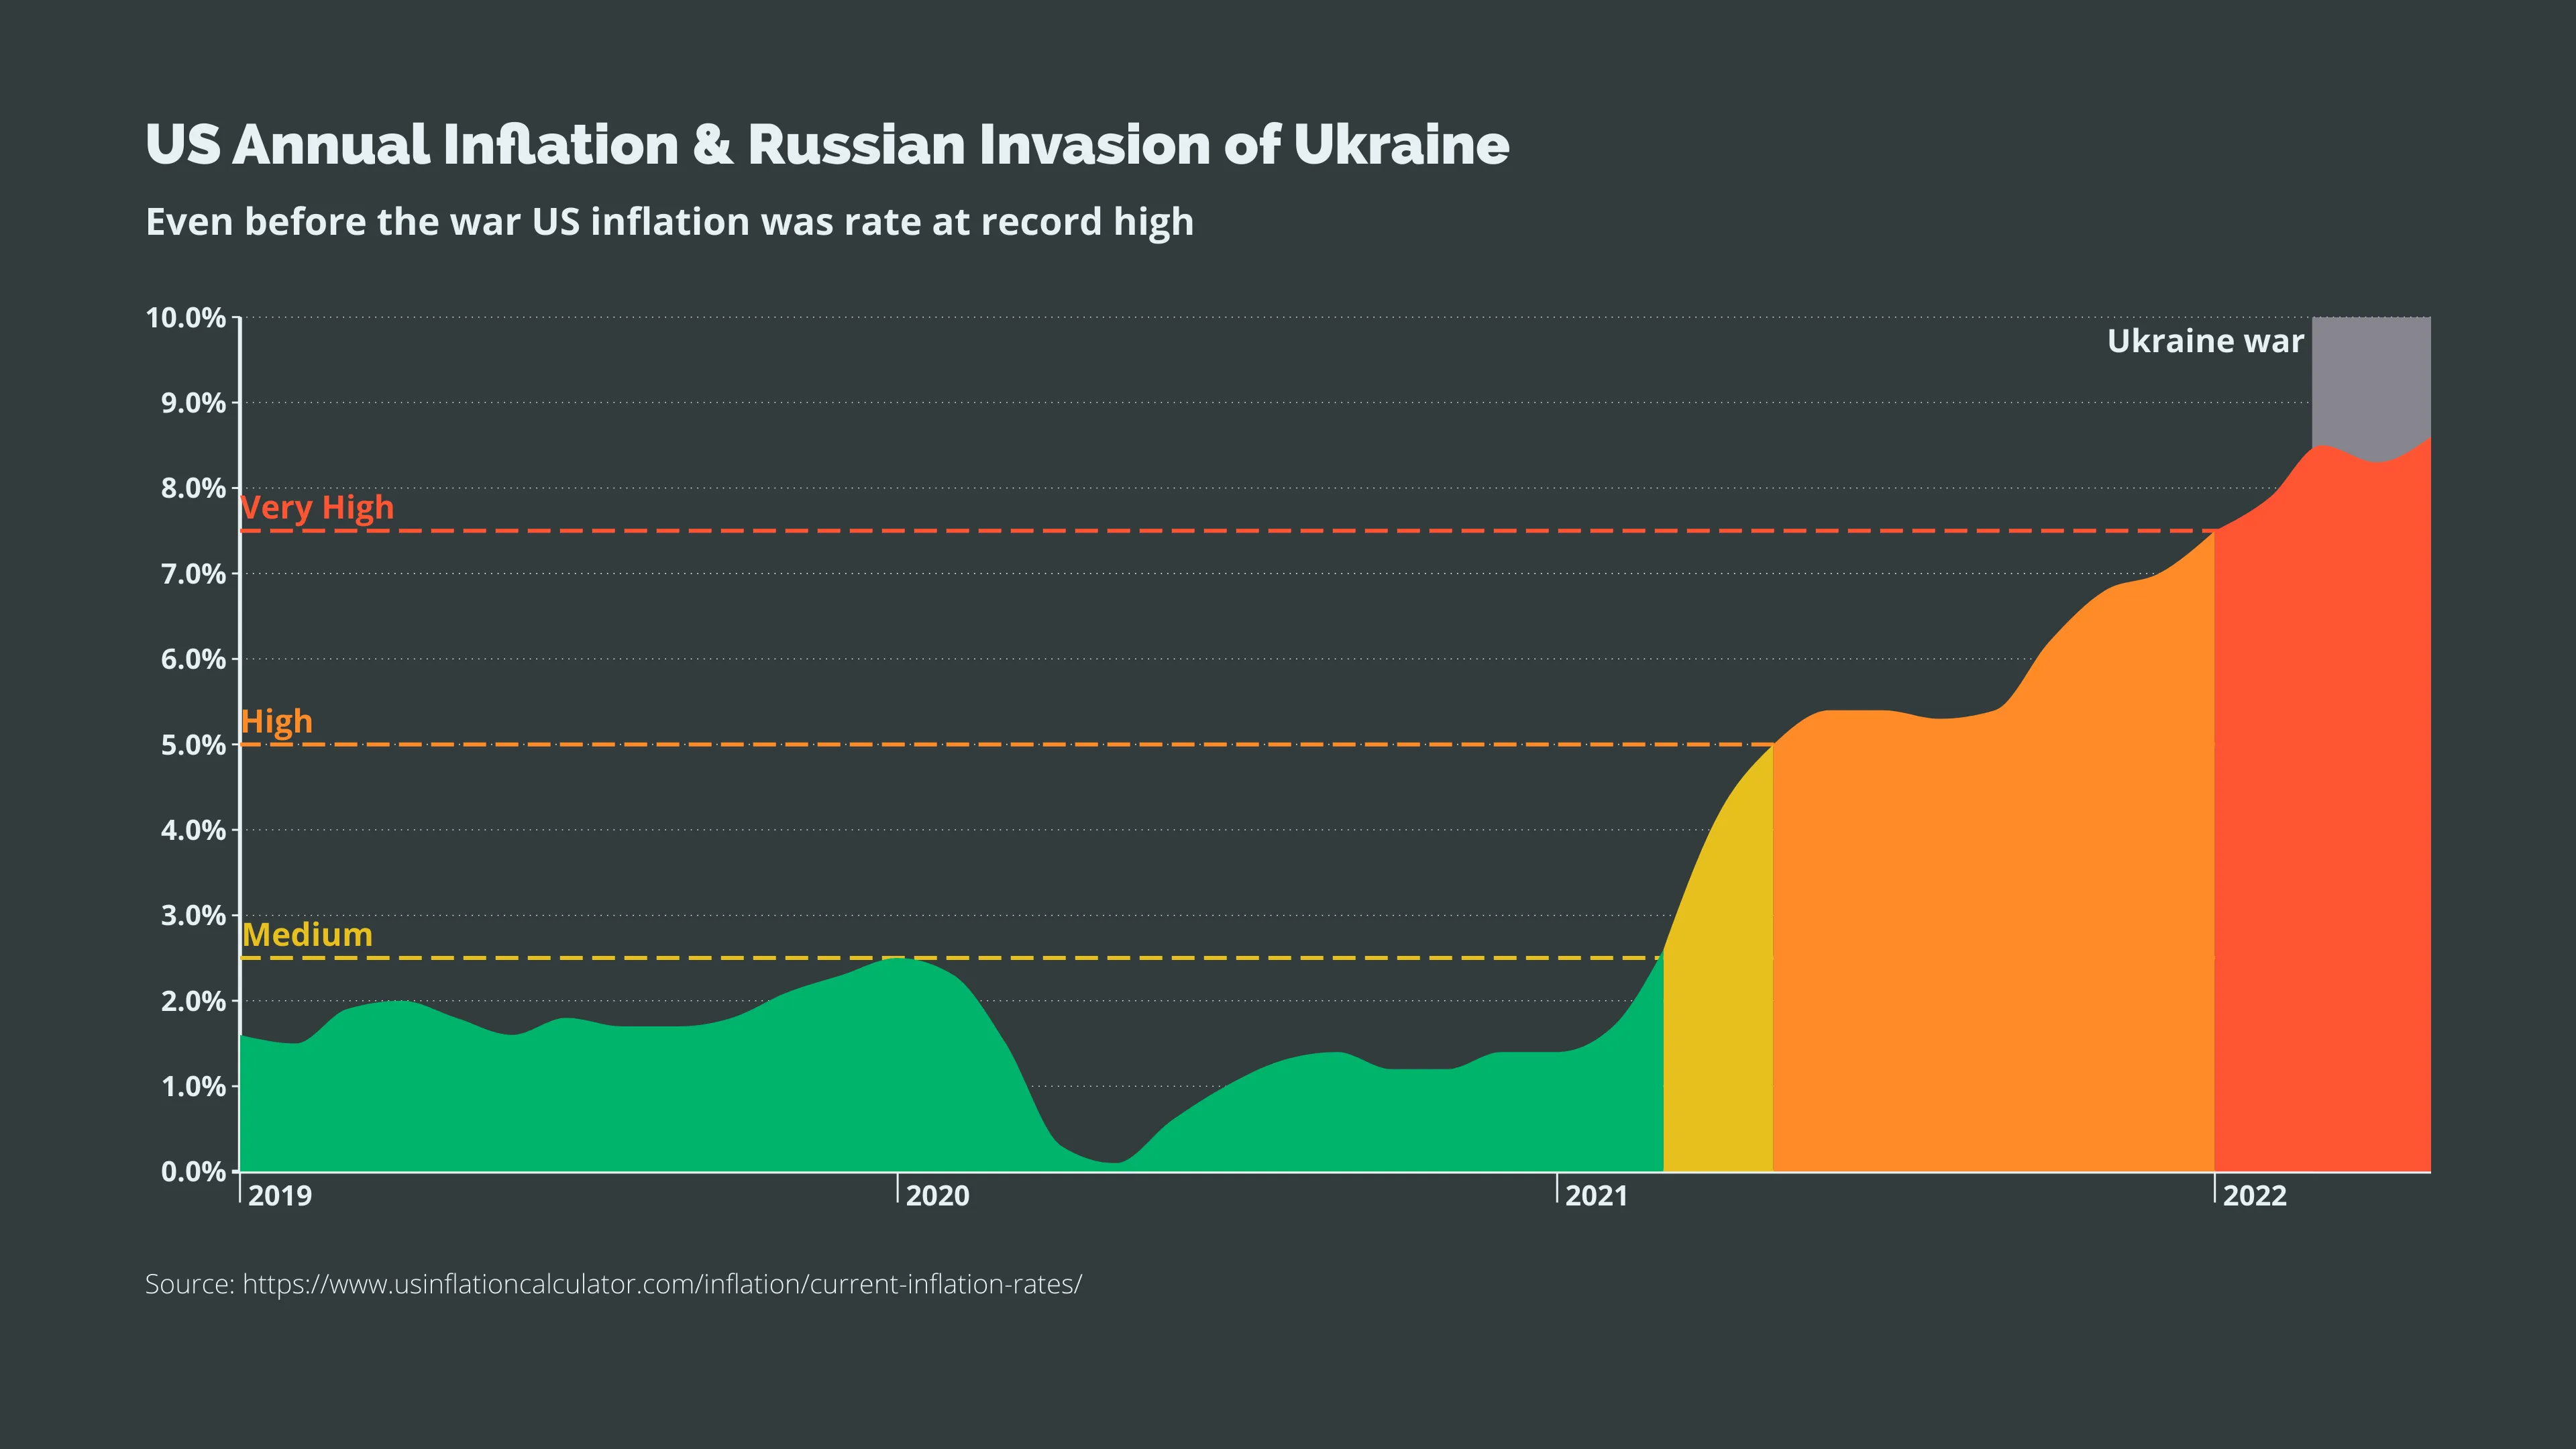
Undeniably, the ongoing Russian invasion of Ukraine has a strong effect on the inflation rates in the US and all over the world.
While nobody can say for sure how consumer prices will continue to develop through the second half of 2022 and beyond, we can take a look back at the past. What we learn is, that it is not economic uncertainty due to the war alone which leads to the price increases we all need to cope with at the moment: COVID-19, a global supply chain crisis and the related international chip shortage, as well as the ongoing climate catastrophe all pushed the US inflation rate to unforeseen heights since the start or 2021.
Source: https://www.usinflationcalculator.com/inflation/current-inflation-rates/
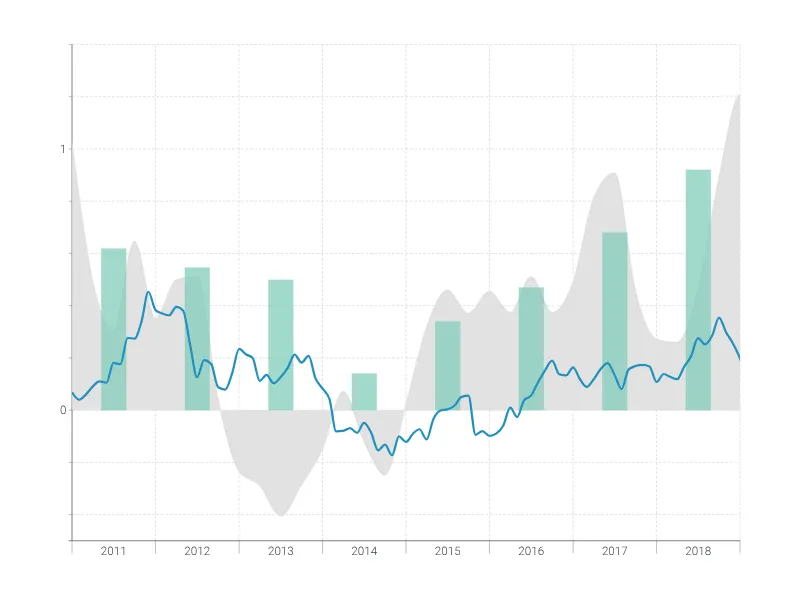
Dies ist ein Beispiel für Vizzlos "Zeitreihendiagramm"
Komplexes Zeitreihendiagramm zur Visualisierung detaillierter Finanzdaten.
Finanzen & Wirtschaft Balken- & Säulendiagramme Linien- & Flächendiagramme Zeitbasierte Diagramme