Chart Vizzard
Vizzlos KI-basierter Diagramm-Generator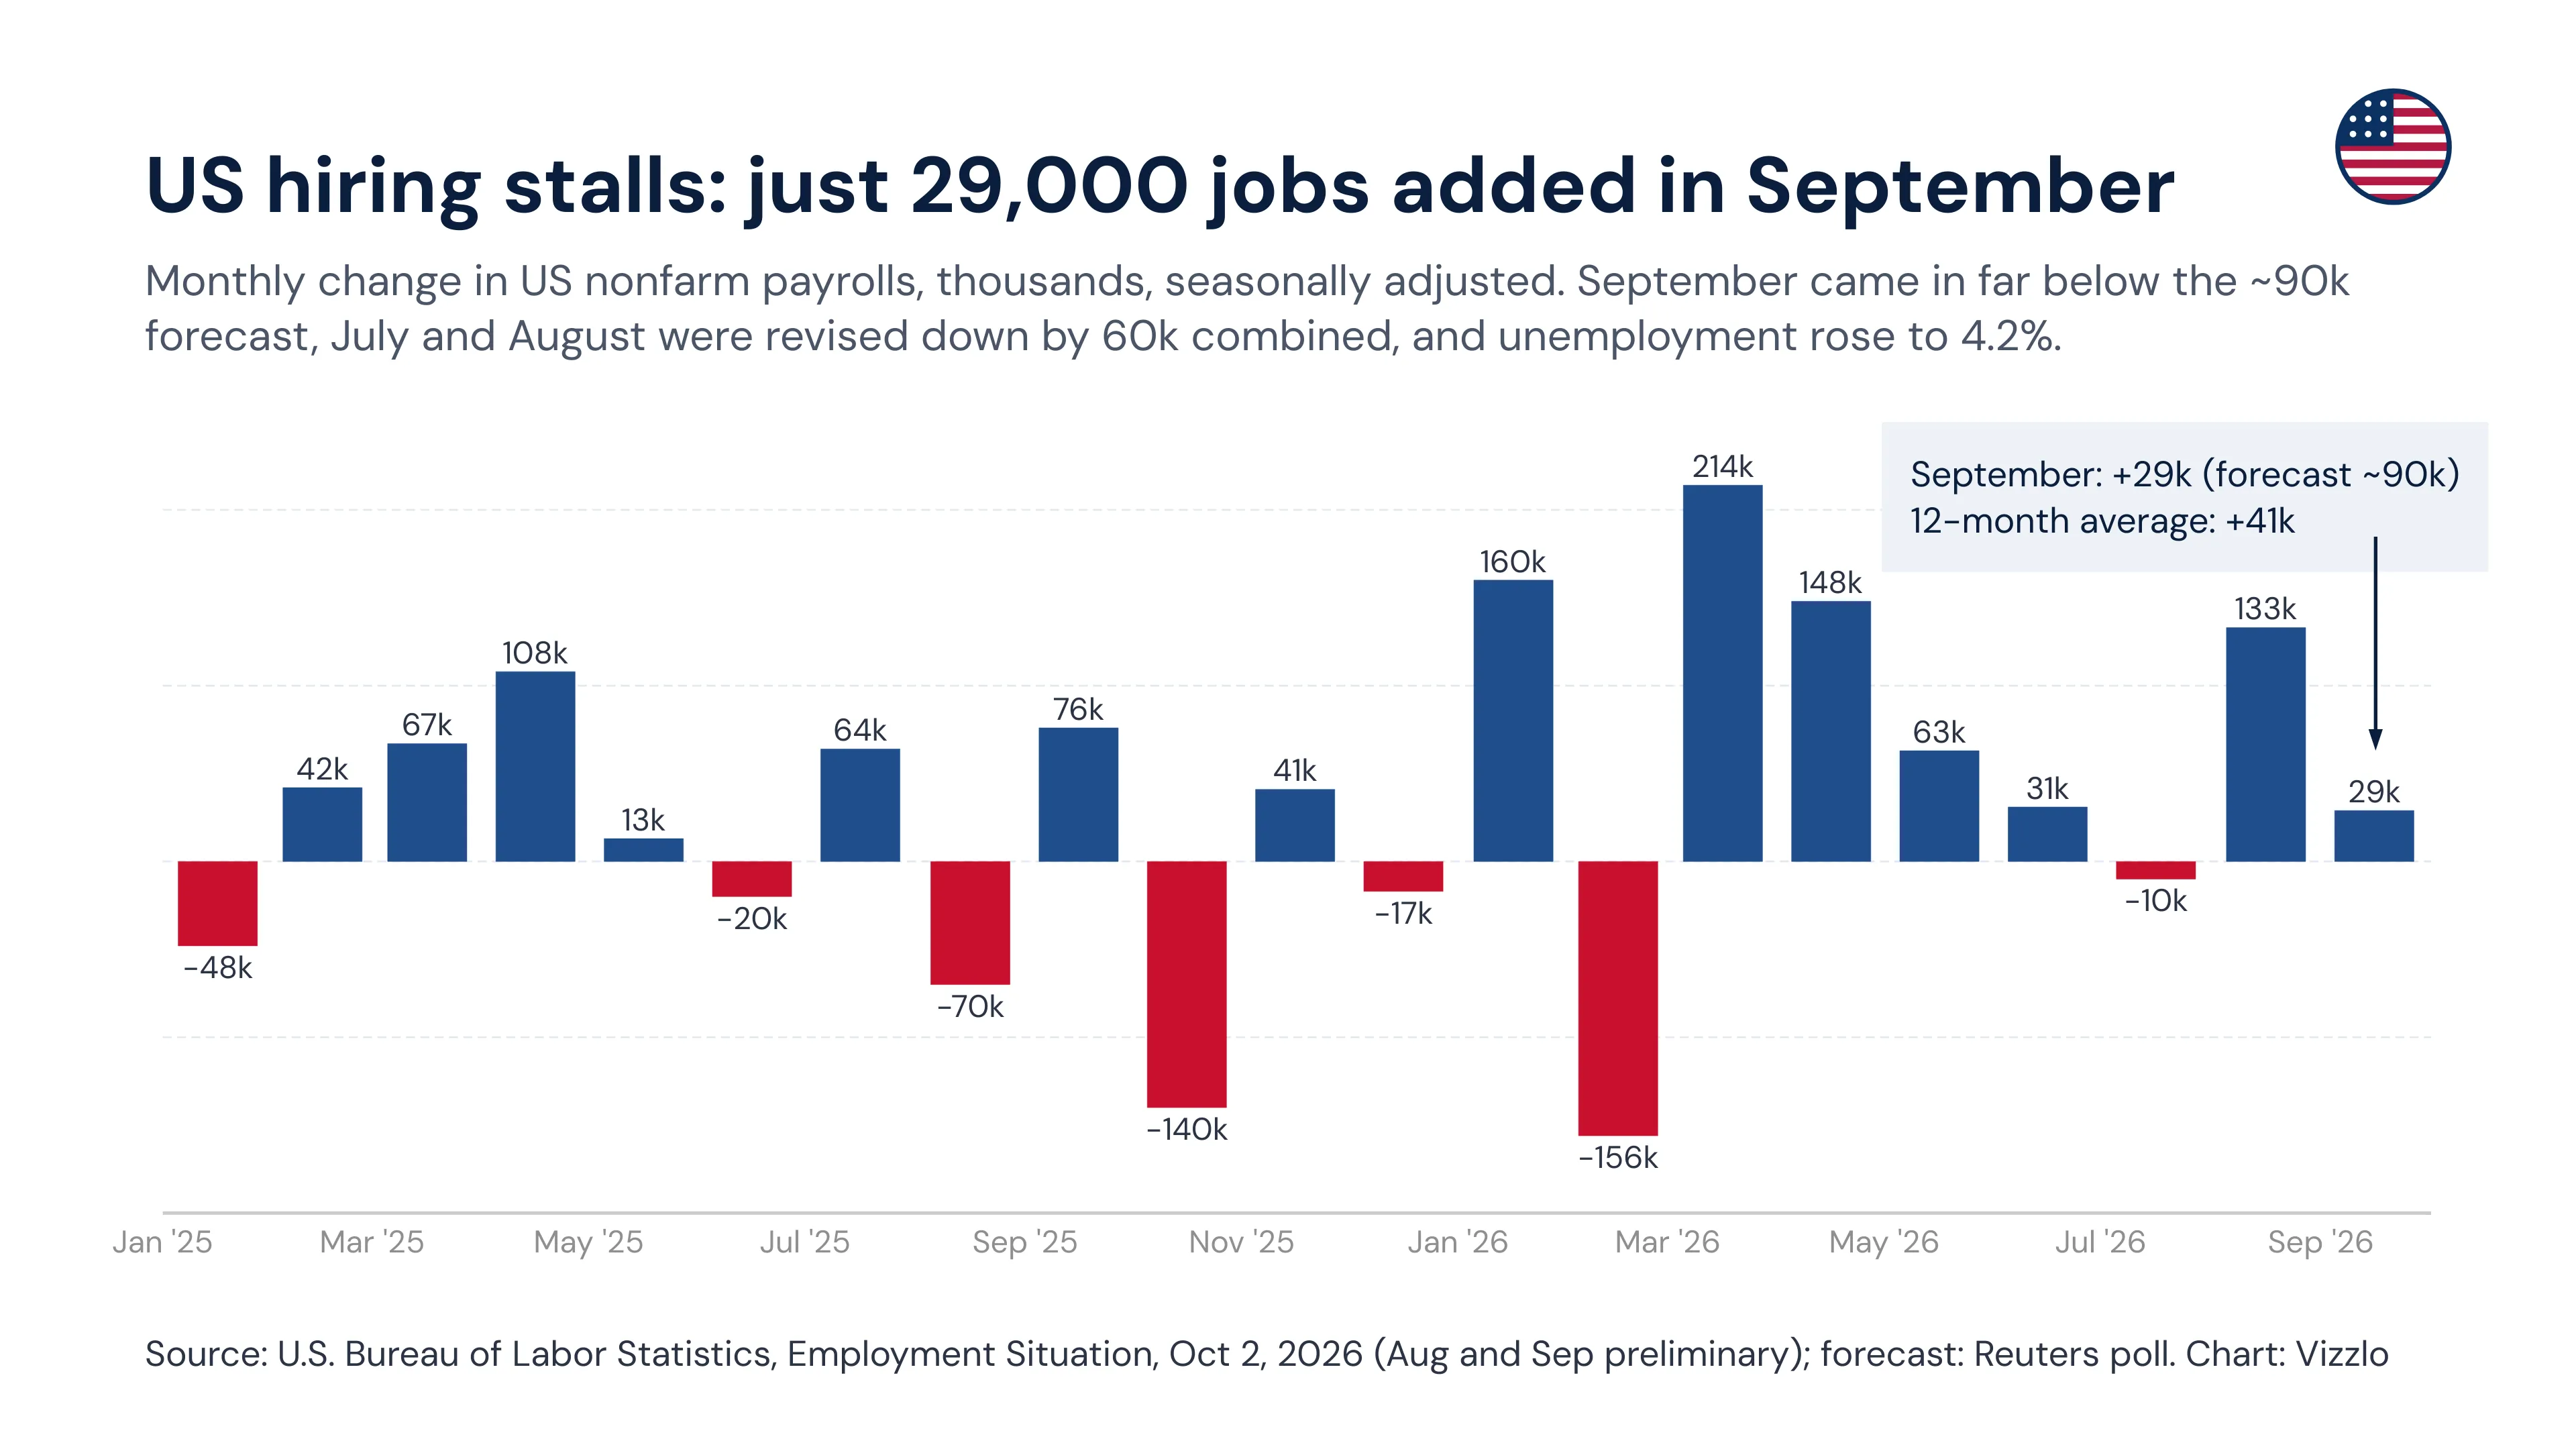
US hiring stalls: just 29,000 jobs added in September
US employers added only 29,000 jobs in September 2026, far below the roughly 90,000 economists had expected, and the unemployment rate rose to 4.2% from 4.1% in August, according to the Bureau of Labor Statistics’ Employment Situation report published on 2 October 2026. Earlier months were also revised lower: July is now a loss of 10,000 jobs (previously +21,000) and August a gain of 133,000 (previously +162,000), a combined downward revision of 60,000.
A labor market that has gone sideways
Payroll growth has swung between gains and losses for almost two years. Over the 12 months to September, the economy added an average of just 41,000 jobs a month (45,000 in the 12 months to August, as Quartz noted). Private employers added 46,000 jobs while government shed 17,000, according to Fox Business.
| Month | Payroll change (thousands) | Unemployment rate |
|---|---|---|
| Jan 2026 | +160 | 4.3% |
| Feb 2026 | −156 | 4.4% |
| Mar 2026 | +214 | 4.3% |
| Apr 2026 | +148 | 4.3% |
| May 2026 | +63 | 4.3% |
| Jun 2026 | +31 | 4.2% |
| Jul 2026 (revised) | −10 | 4.1% |
| Aug 2026 (revised, preliminary) | +133 | 4.1% |
| Sep 2026 (first estimate) | +29 | 4.2% |
What moved in September (BLS):
- Health care: +17,000 (below its 12-month average of about 33,000, per Quartz)
- Construction: +11,000
- Manufacturing: +9,000
- Financial activities: −7,000
- Other major industries showed little change.
- Average hourly earnings: up 5 cents (0.1%) to $37.81, +3.0% year on year
- Unemployed: 7.1 million; labor force participation 61.8%; average workweek unchanged at 34.4 hours
What it means for the Fed
The weak report cools the case for another rate increase. The Fed raised rates by a quarter point in September as the Iran war and other shocks pushed up inflation. After the release, traders cut the odds of an October hike from above 25% to below 20% and slightly trimmed bets on a December move, Reuters reported. The 10-year Treasury yield fell from 5.24% to 5.17%, and stocks rose: the S&P 500 gained 0.96% and the Nasdaq 1.63%, according to Fox Business. Softer wage growth (3.0% vs. 3.2% expected) also eases inflation worries. Vanguard economist Adam Schickling described it to Fox Business as a “low-hire, low-fire” environment rather than a collapse.
How to read the chart
- Bars: the month-on-month change in total US nonfarm payroll employment, in thousands of jobs, seasonally adjusted. Every bar carries its value.
- Blue bars are months with job gains, red bars months with net job losses.
- Callout (top right): September’s first estimate (+29k) against the ~90k consensus forecast, and the 12-month average gain (+41k, October 2025 to September 2026).
- The x-axis runs from January 2025 to September 2026; the unemployment rate is mentioned in the subtitle and in the table above, not plotted.
Sources
- U.S. Bureau of Labor Statistics: The Employment Situation — September 2026, released 2 Oct 2026
- U.S. Bureau of Labor Statistics: Table B-1, Employees on nonfarm payrolls by industry sector, released 2 Oct 2026
- Federal Reserve Bank of St. Louis (FRED), BLS data: All Employees, Total Nonfarm (PAYEMS), accessed 3 Oct 2026 (monthly levels used to compute changes for January 2025 to September 2026)
- Federal Reserve Bank of St. Louis (FRED), BLS data: Unemployment Rate (UNRATE), accessed 3 Oct 2026
- Reuters via Business Standard: US Fed may skip October rate hike as labour market cools more than expected, 2 Oct 2026
- Fox Business: US economy added 29,000 jobs in September, a slower pace than expected, 2 Oct 2026
- Quartz via Yahoo Finance: September 2026 jobs report: payrolls, unemployment rate, 2 Oct 2026
- CNBC: Labor market faltered in September as jobs increased by just 29,000, unemployment rate rose to 4.2%, 2 Oct 2026
Notes
- August and September figures are preliminary. BLS will revise them in the next two monthly reports, and the annual benchmark revision can change earlier months too.
- Monthly changes were calculated from BLS payroll levels (in thousands) via FRED. The July–September values match the changes BLS reports in the release.
- The consensus forecast differs by source: Reuters and Fox Business cite 90,000, Quartz cites 84,000. The chart uses “~90k” (Reuters poll).
- There is no unemployment rate for October 2025: the household survey was not conducted that month because of the federal government shutdown. The payroll figure for that month is available and shown.
- Figures are rounded to the nearest thousand jobs and one decimal for rates, as published.
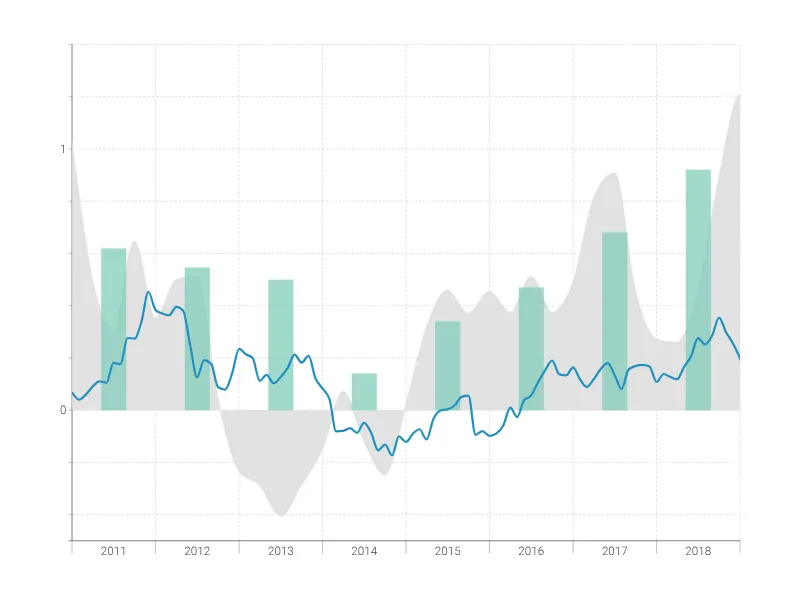
Dies ist ein Beispiel für Vizzlos "Zeitreihendiagramm"
Komplexes Zeitreihendiagramm zur Visualisierung detaillierter Finanzdaten.
Finanzen & Wirtschaft Balken- & Säulendiagramme Linien- & Flächendiagramme Zeitbasierte Diagramme