VORSCHAU
Chart Vizzard
Vizzlos KI-basierter Diagramm-GeneratorSUPERBOWL HALF-TIME SHOWS
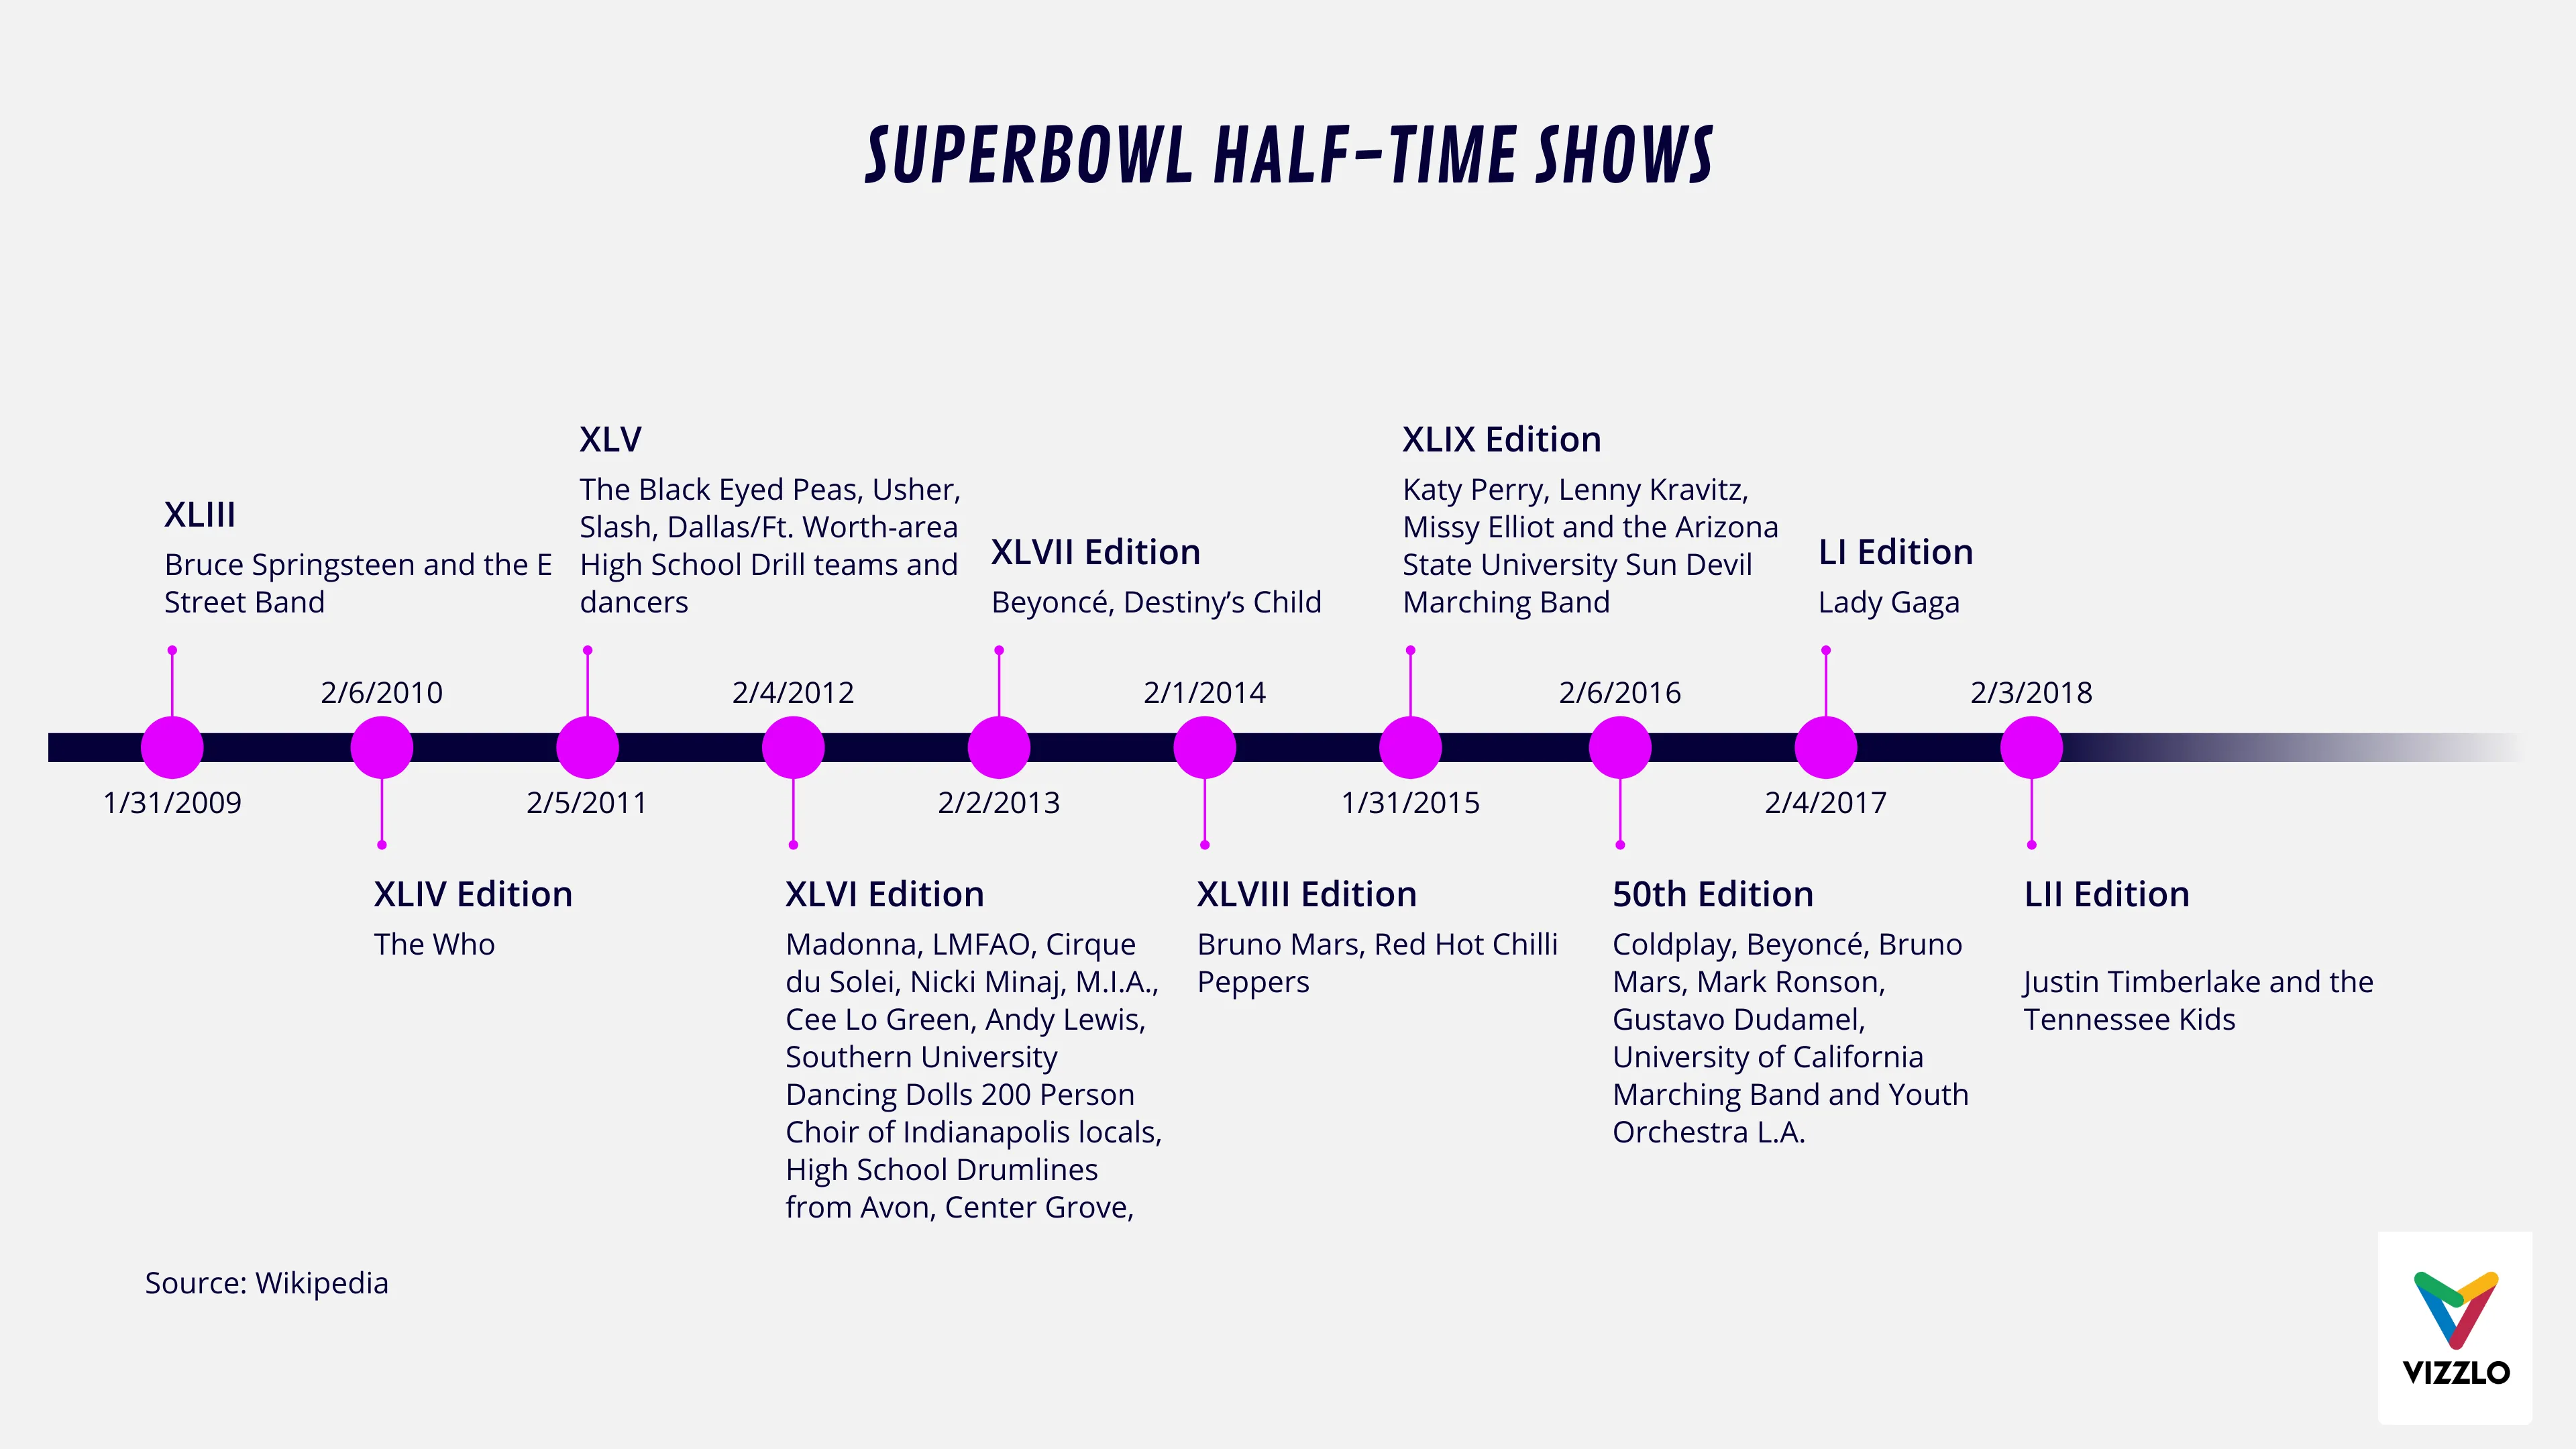
This entertaining tradition started in January 15th, 1967. Back then it featured college marching bands and eventually escalated to more varied shows over the decades. The half time show of the Super Bowl XLIX featuring Katy Perry was viewed by 118.5 million people, making it the most-watched television broadcast in U.S. history. Here’s a trip down memory lane with the ten last Super Bowl [Halftime Shows] (https://www.nfl.com/super-bowl/halftime-show).
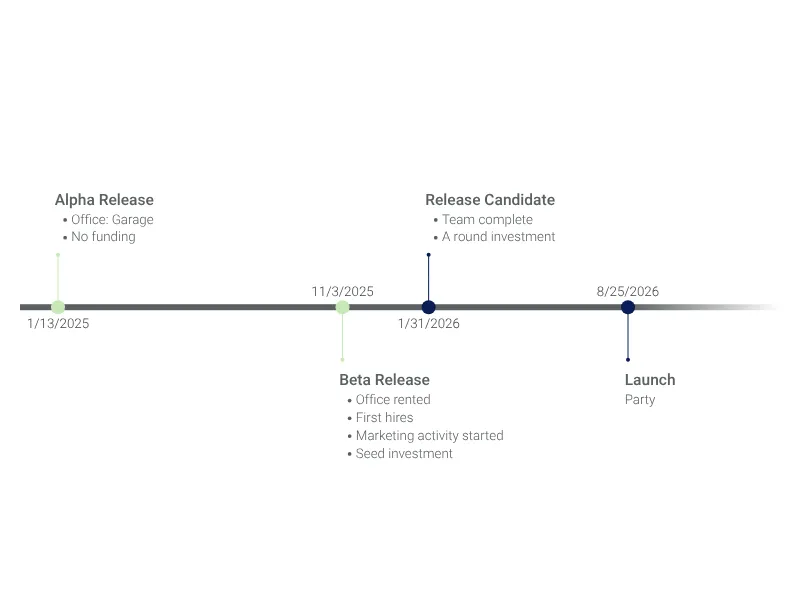
Dies ist ein Beispiel für Vizzlos "Zeitachsendiagramm"
Effiziente Projektplanung und -terminierung mit beeindruckenden Zeitachsen – mit nur wenigen Klicks.
Projektmanagement Zeitbasierte Diagramme Meilenstein-Diagramme Zeitleisten & Roadmaps