Chart Vizzard
Vizzlo's AI-based chart generatorSUPERBOWL HALF-TIME SHOWS

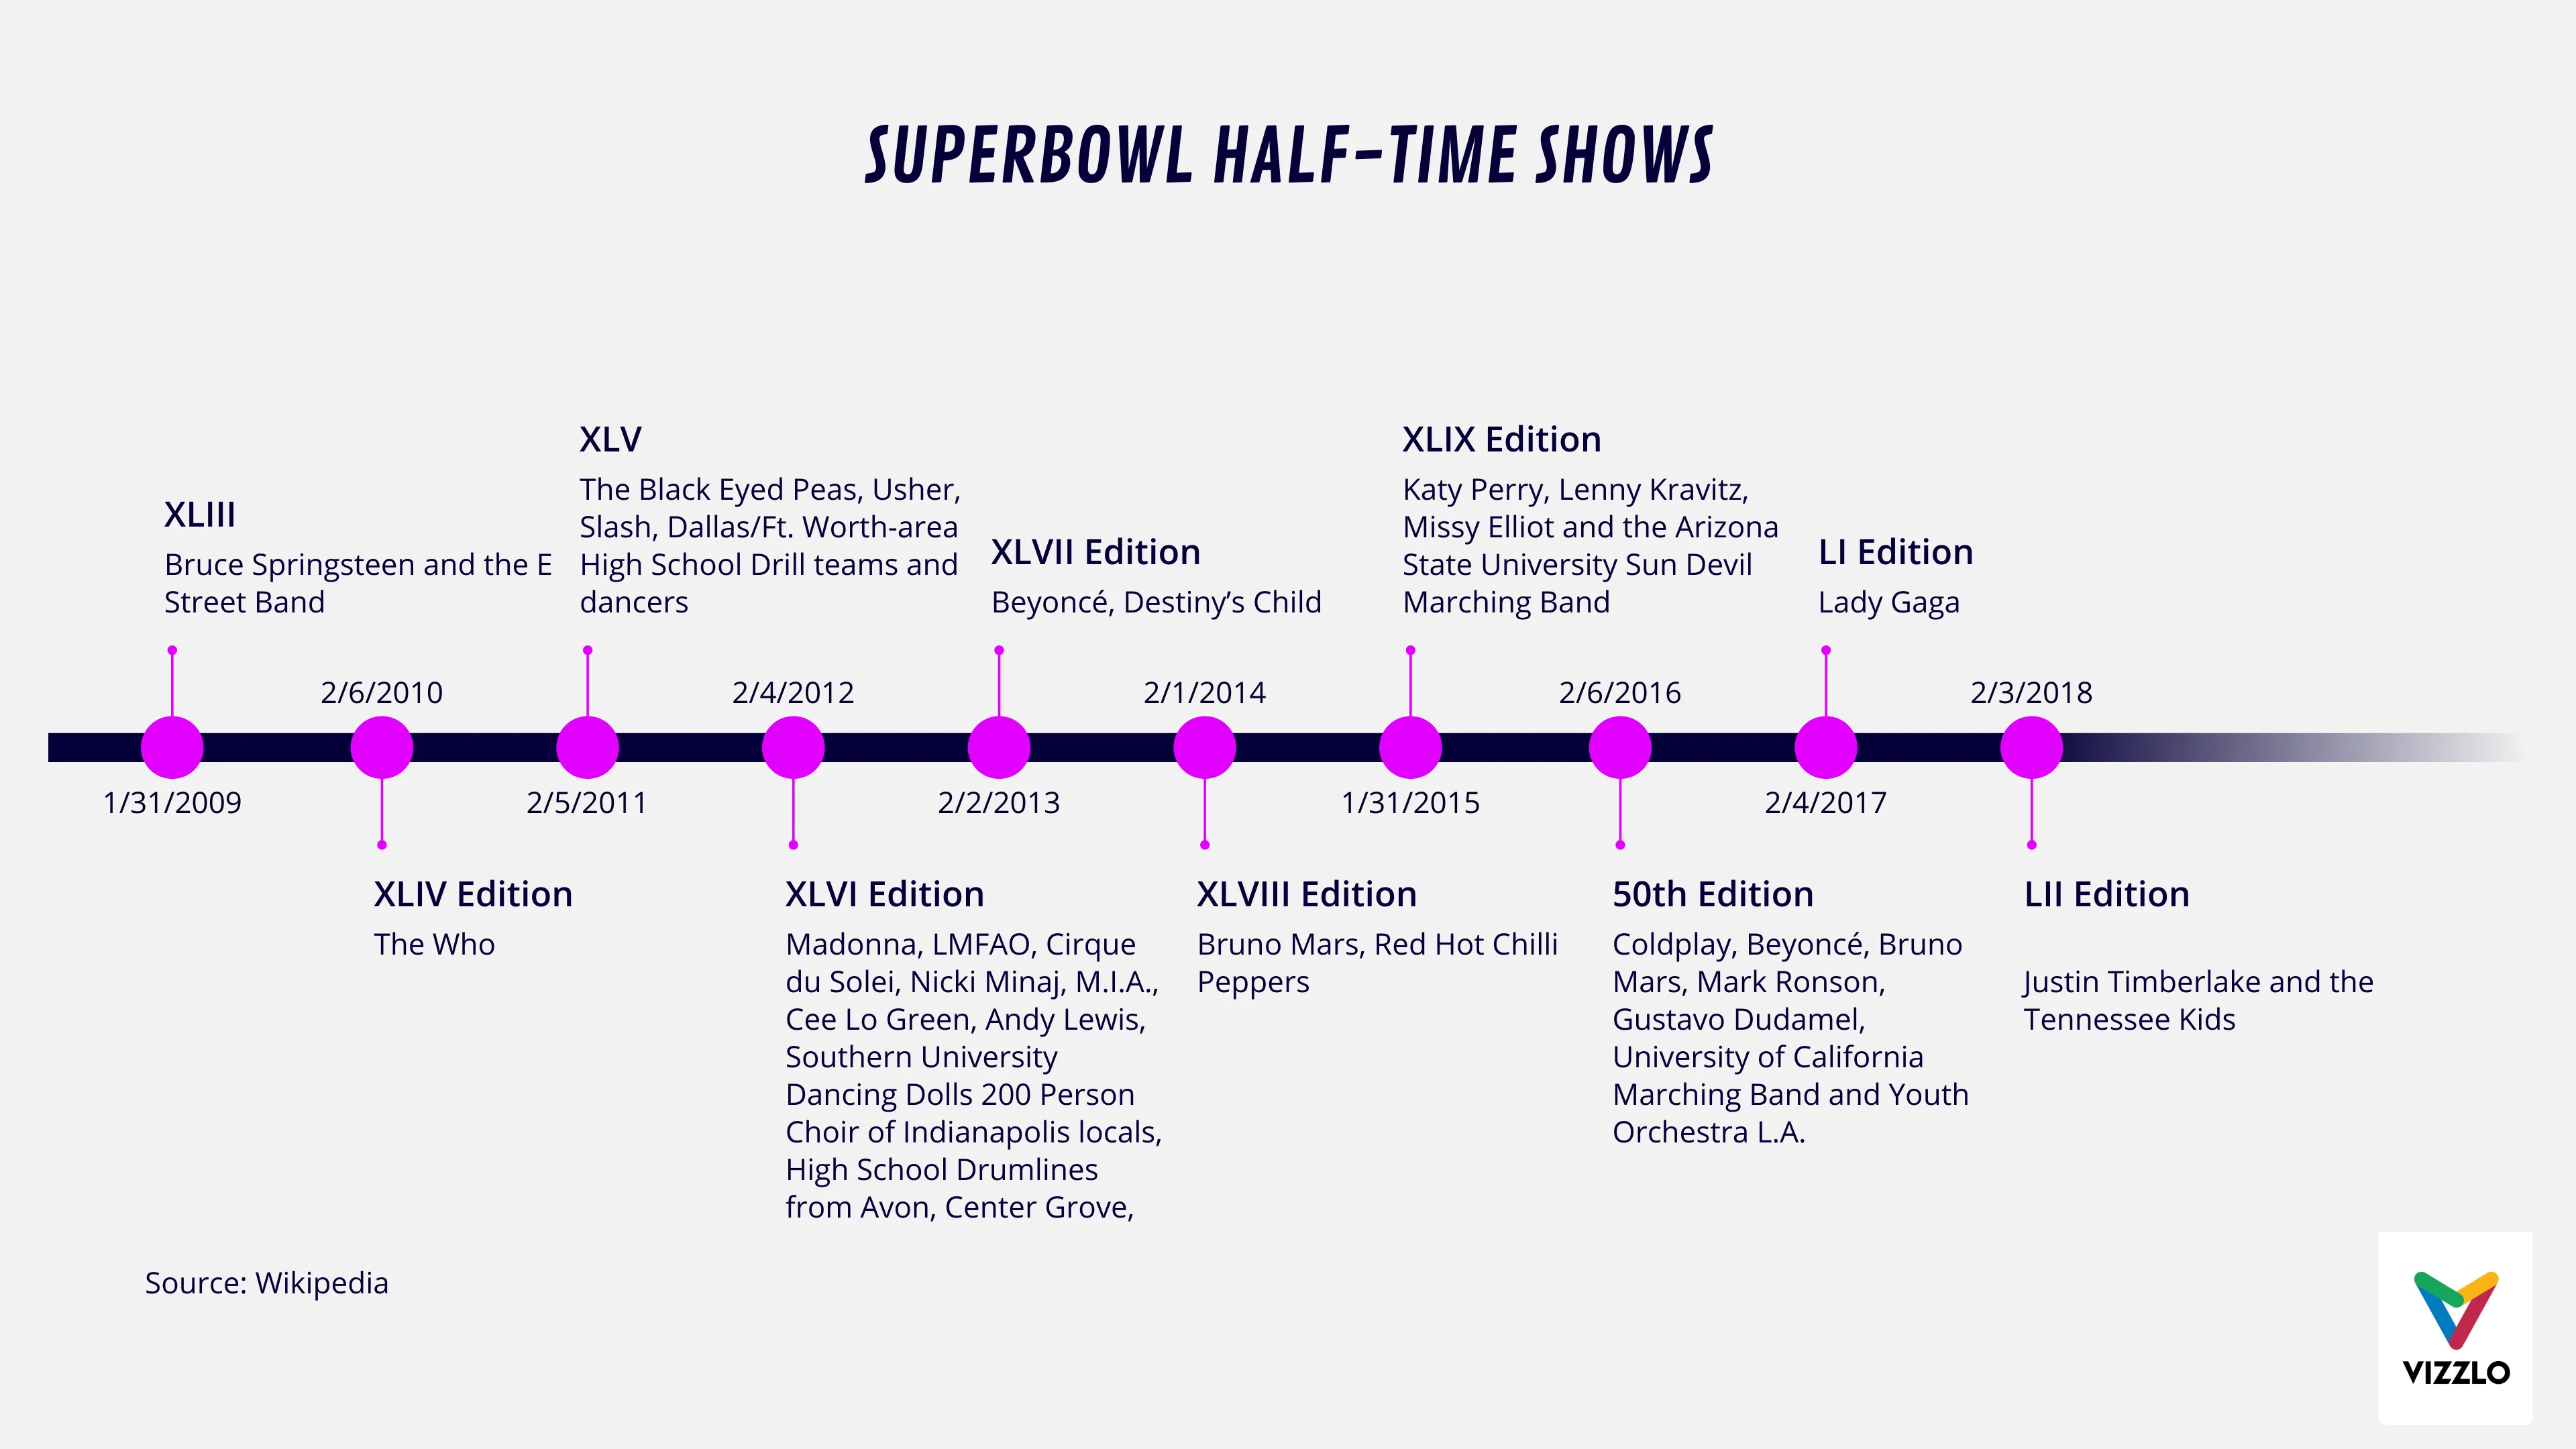
This entertaining tradition started in January 15th, 1967. Back then it featured college marching bands and eventually escalated to more varied shows over the decades. The half time show of the Super Bowl XLIX featuring Katy Perry was viewed by 118.5 million people, making it the most-watched television broadcast in U.S. history. Here’s a trip down memory lane with the ten last Super Bowl [Halftime Shows] (https://www.nfl.com/super-bowl/halftime-show).

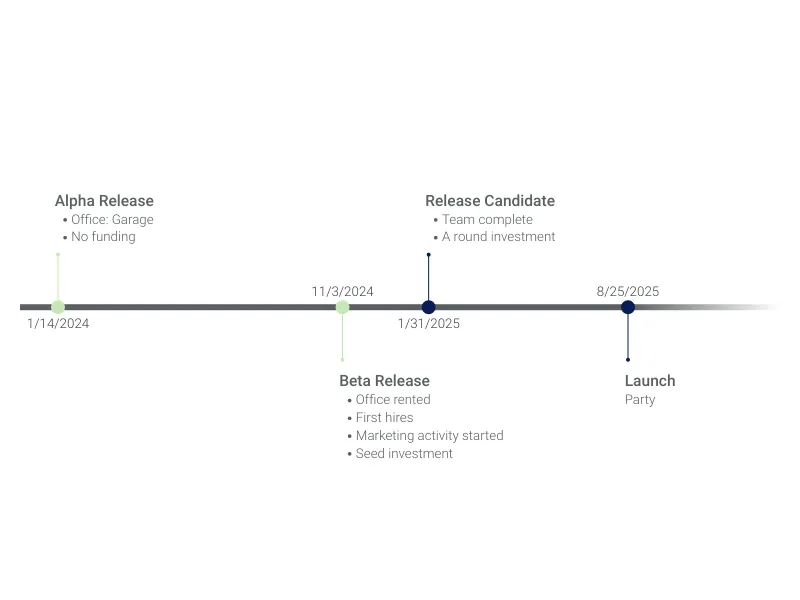
This is an example of Vizzlo's “Timeline Chart”
Efficient project planning and scheduling with impressive timelines with just a few clicks.
Project Management Time-based charts Milestone Charts Timelines & Roadmaps