Chart Vizzard
Vizzlos KI-basierter Diagramm-GeneratorXennials: the microgeneration between the Gen-X and the Millennials
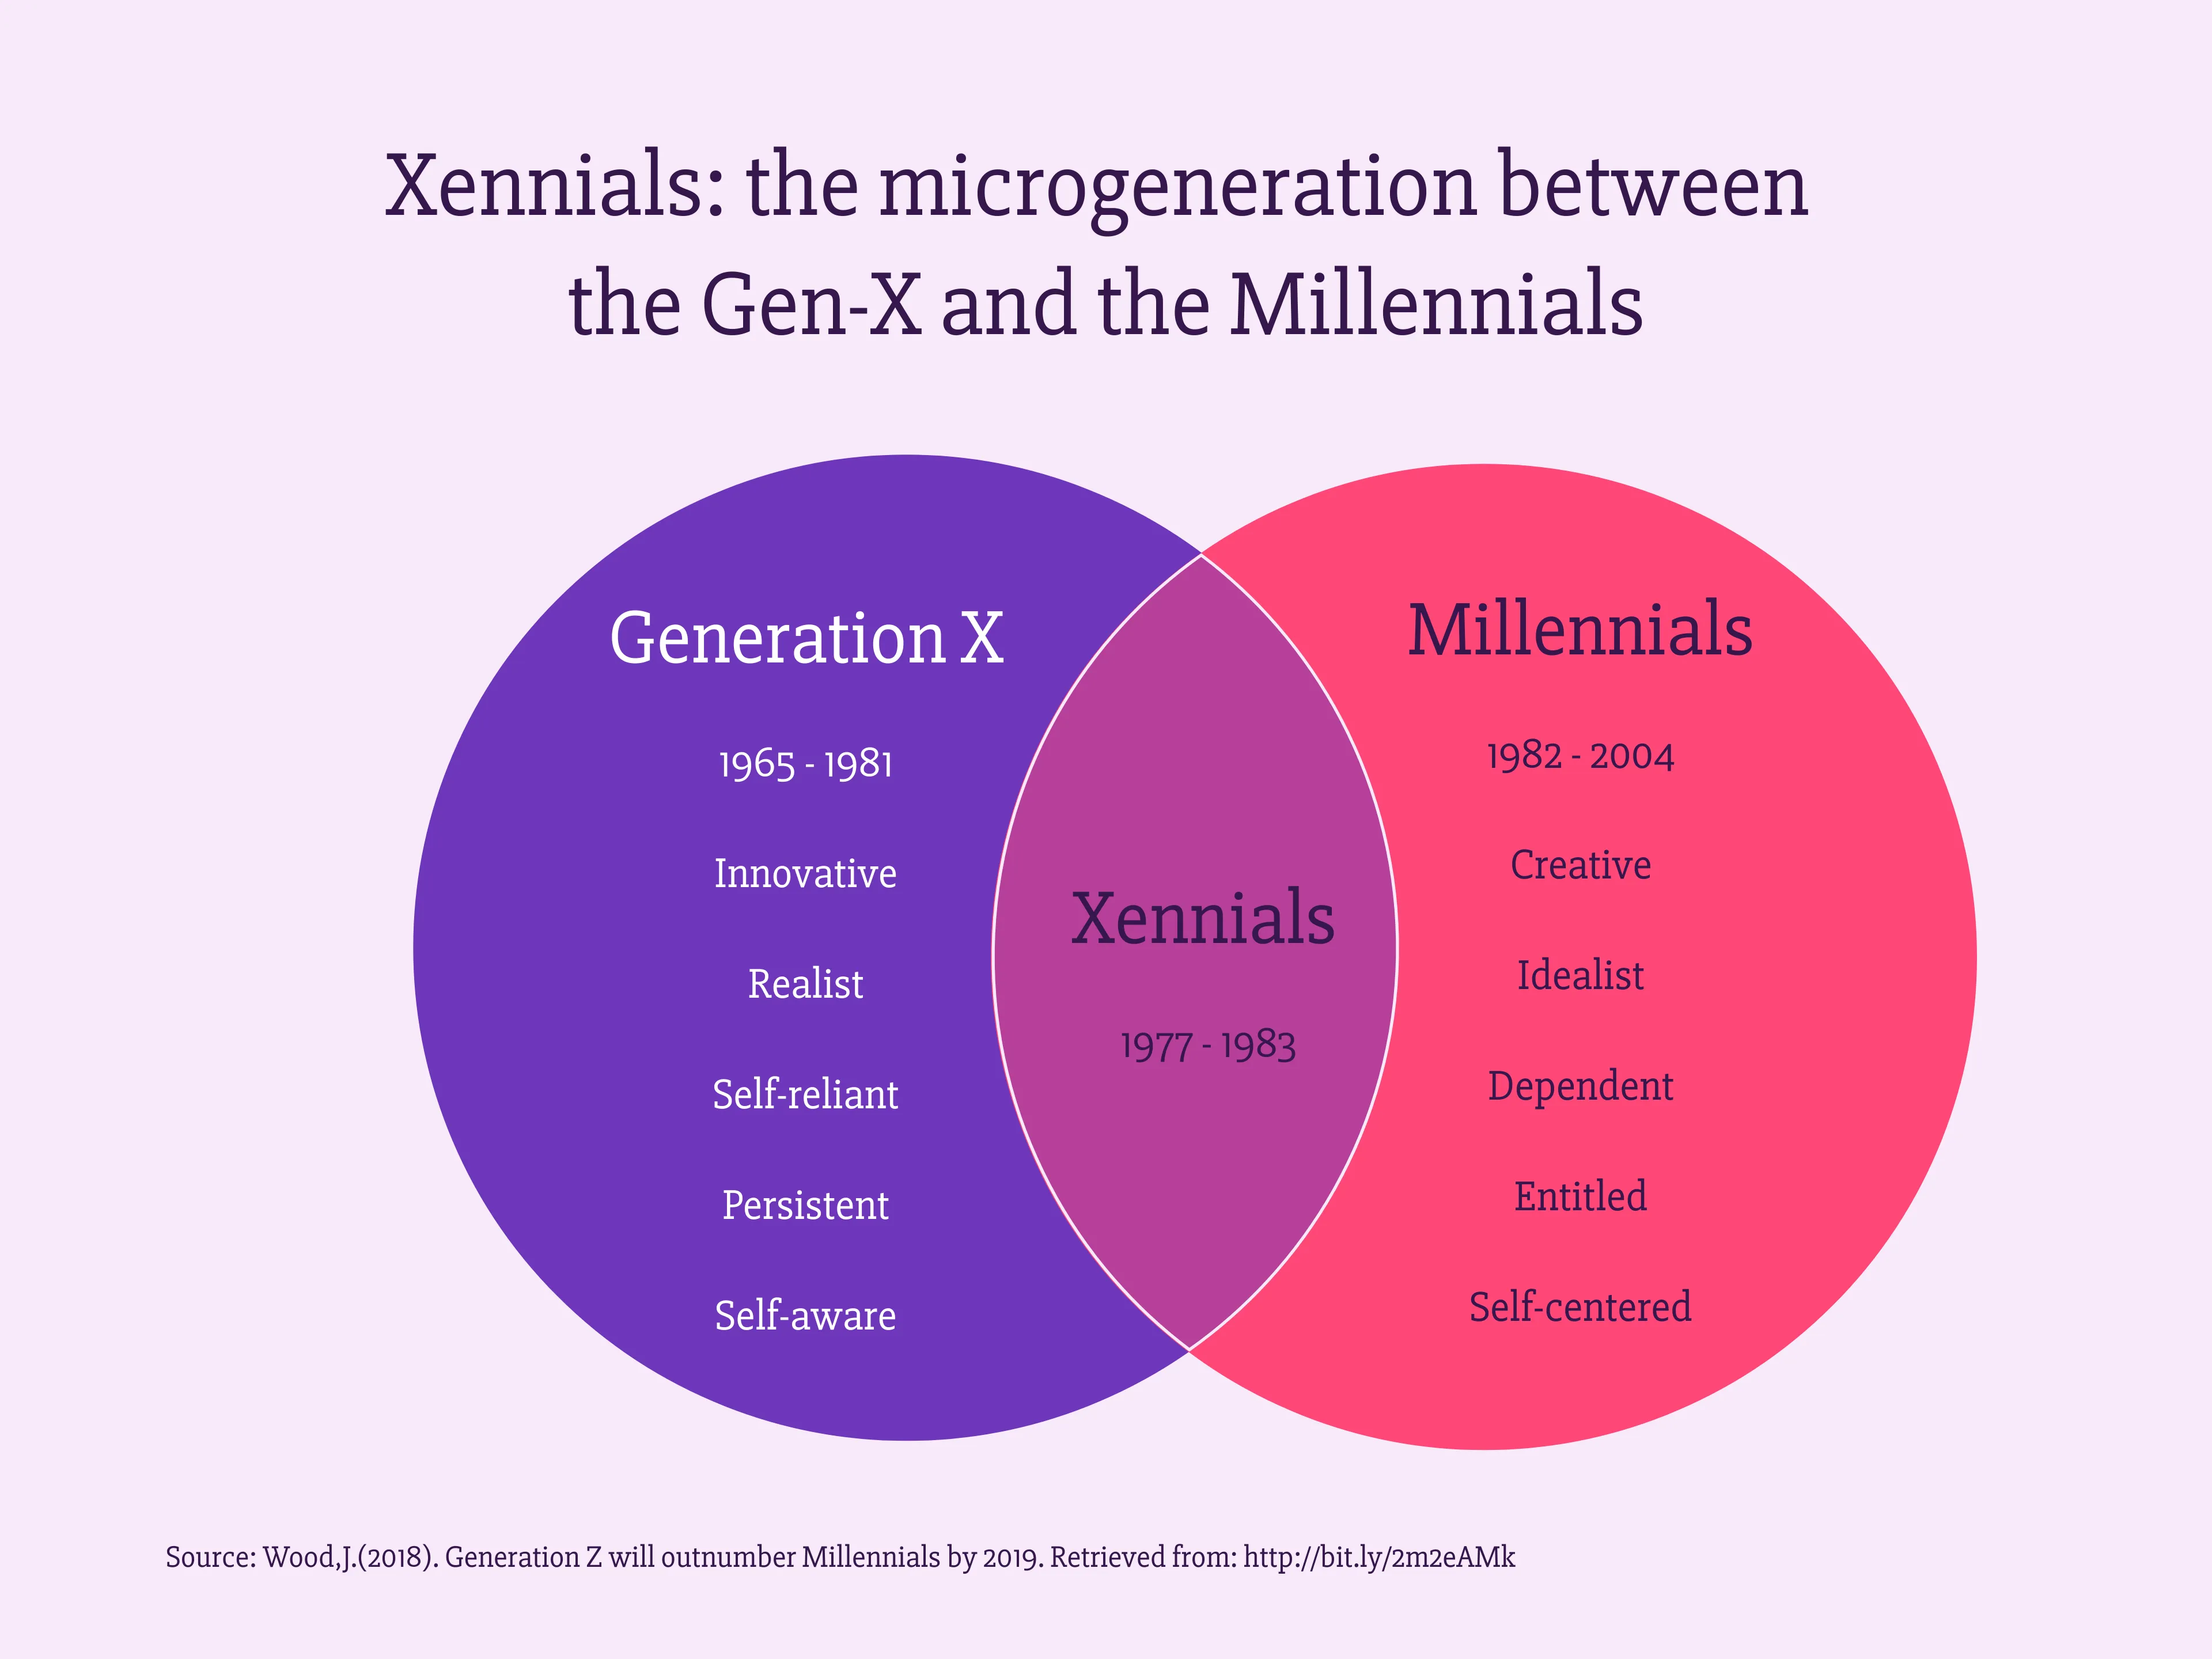
Xennials: what/who are they, what do they eat, how do they leave? Despite their curious name, Xennials aren’t exotic animals or any sci-fi/fantasy ethnic group. They’re, in internet folklore, a transition generation born between 1977 and 1983, who experienced an analogue childhood and a digital adulthood. Are you Xennial? The [Guardian] (https://www.theguardian.com) has prepared a [quiz] (https://www.theguardian.com/culture/2017/jun/27/are-you-a-xennial-take-the-quiz) for you to find out.
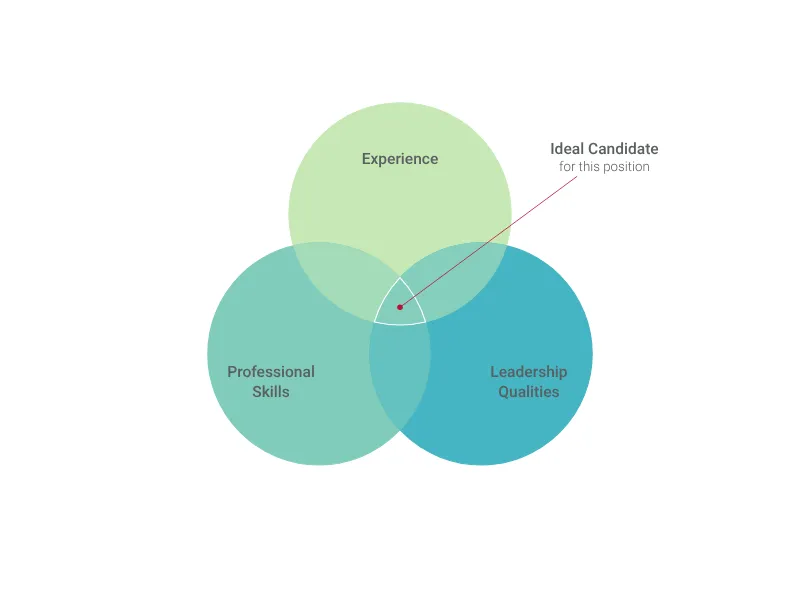
Dies ist ein Beispiel für Vizzlos "Venn-Diagramm"
Erstellen Sie ein Venn-Diagramm, um Schnittmengen und Unterschiede zwischen Gruppen zu visualisieren.
Pitchdeck-Essentials für Startups Linien- & Flächendiagramme Prozess- & Strukturdiagramme