Chart Vizzard
Vizzlo's AI-based chart generatorCreate beautiful Venn diagrams
Vizzlo is a free chart maker that helps you enrich your presentations and reports. Works online, in PowerPoint, and Google Slides.
What is a Venn diagram?
A Venn diagram shows all possible logical relations between different sets or groups of data. In a Venn Diagram, each circle circumscribes a set. Overlapping circles build intersections revealing common elements to two or more groups. The chart is also known as ‘Set diagram’ or ‘Logic diagram’.
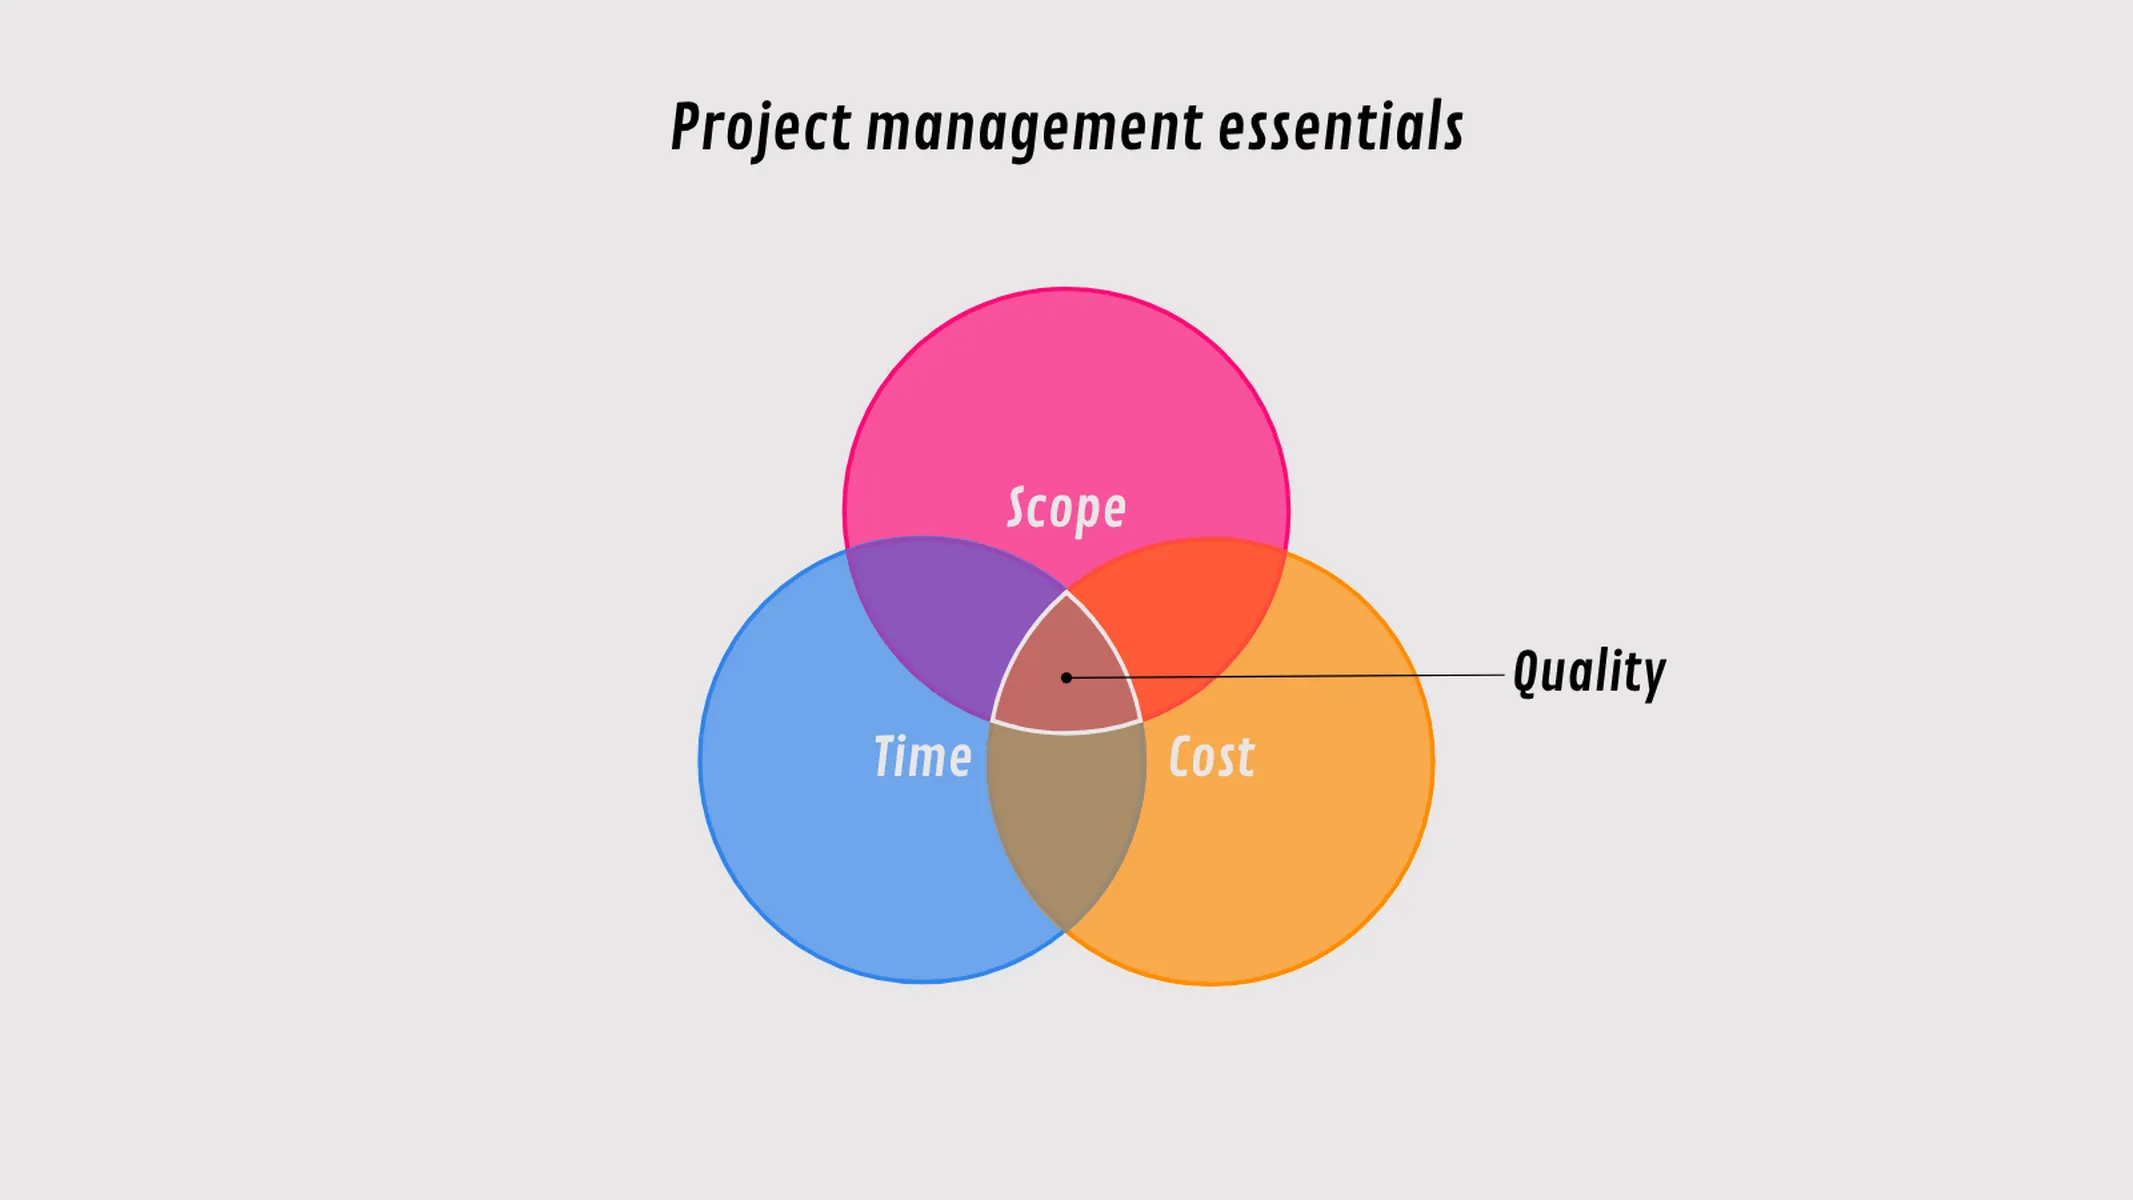
The main point of interest with Venn diagrams are the intersections. Venn diagrams can consist of multiple circle sets. Most commonly used is the 3-circle or triple Venn diagram.
A brief history of the Venn diagram
The Venn diagram we know today was developed by the English mathematician John Venn. Venn proposed a modification of the Euler diagram to become a more comprehensive visualization for probability. The name “Venn diagram,” however, was not coined by the American philosopher Clarence Irving until several years later in 1918.
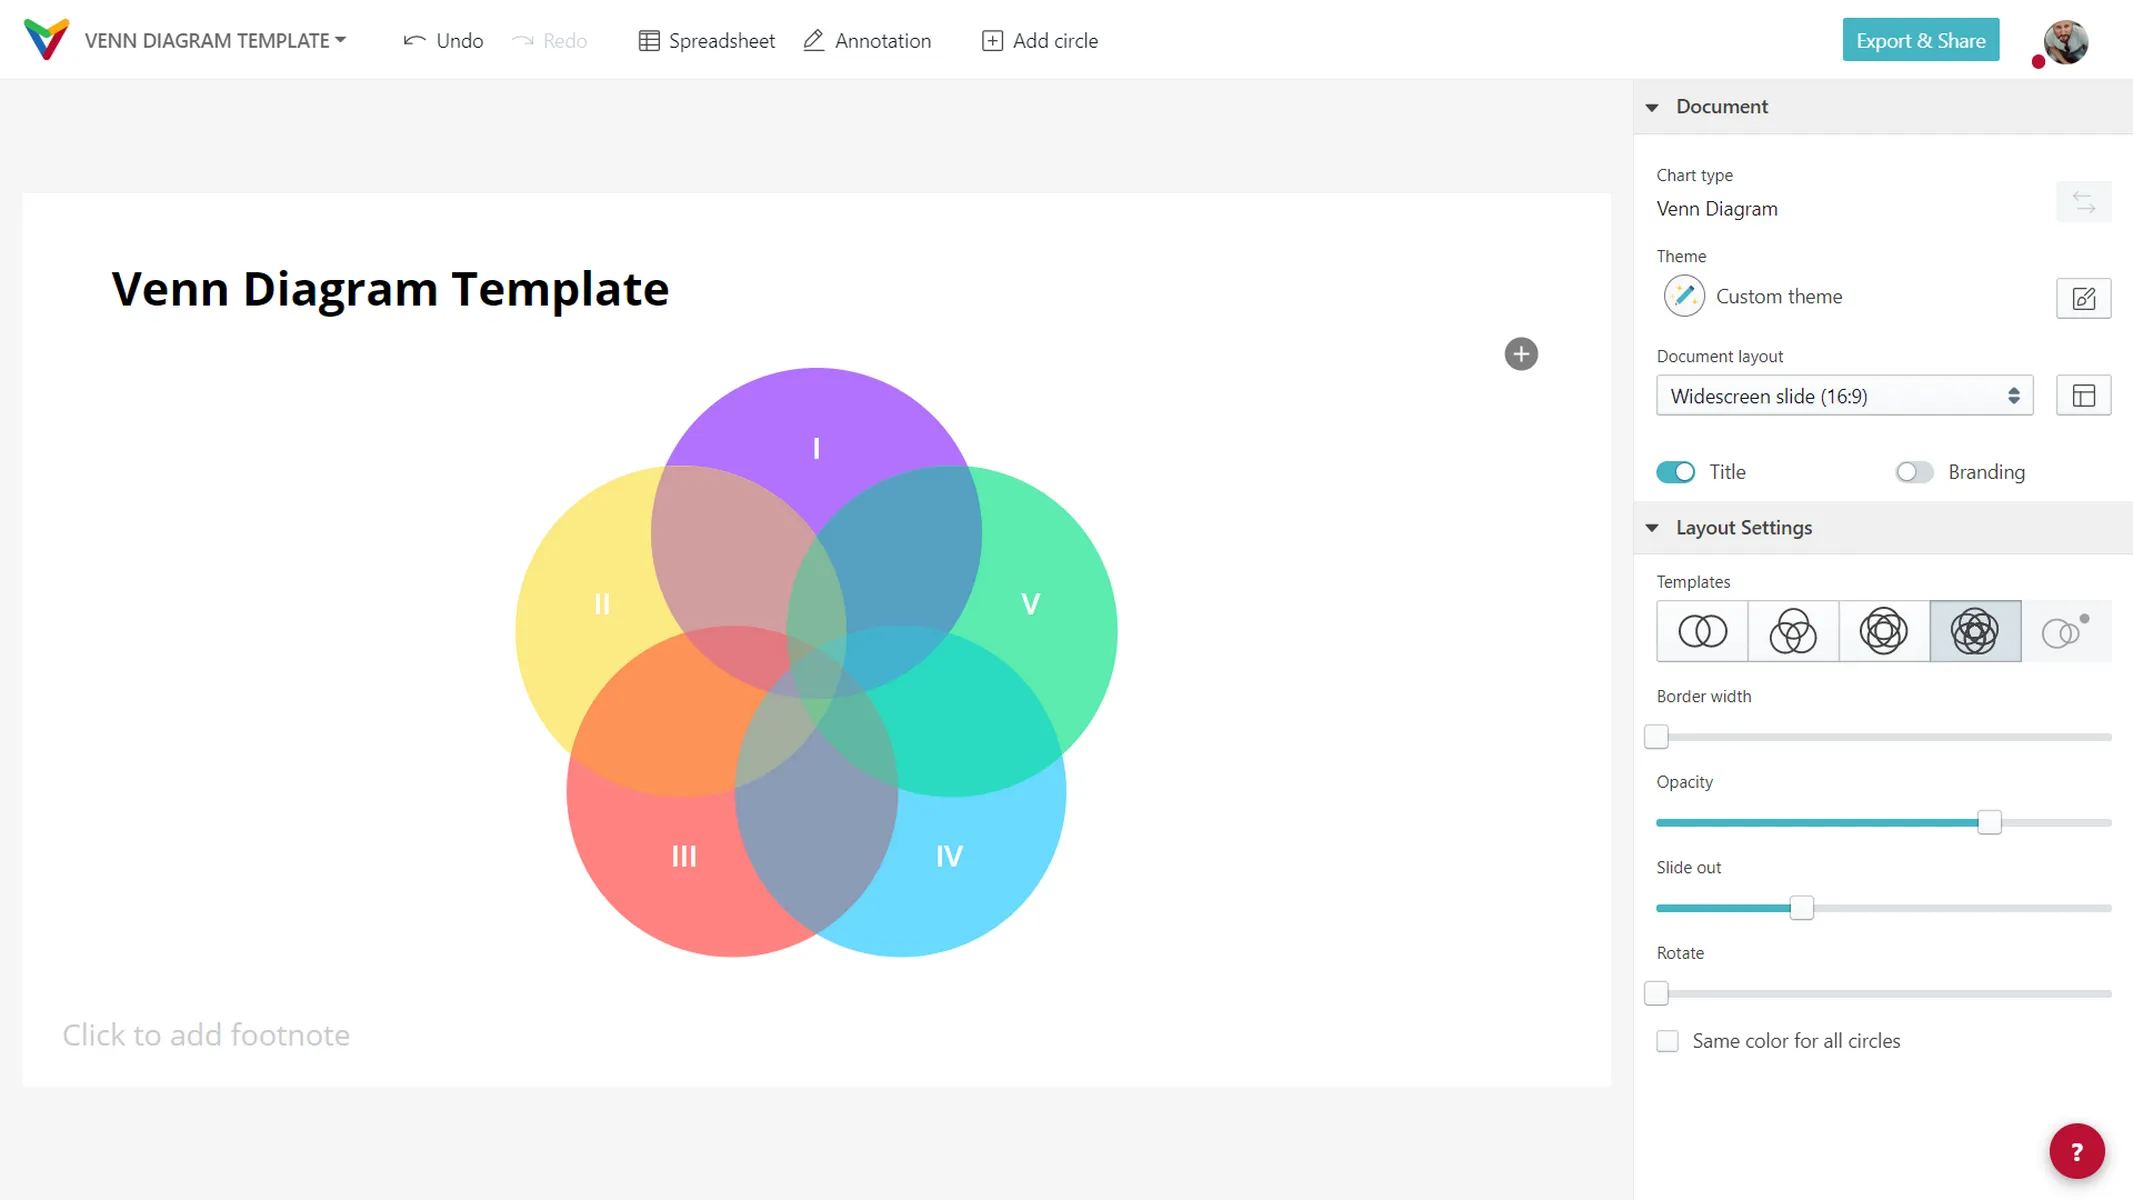
How to create a Venn diagram with Vizzlo?
Make high-quality and colorful Venn diagrams with multiple/unlimited circles and intersections. In this chart, every circle gets a different color by default. But there is also the option to change the color of all circles to be the same by just a click. Their light transparency allows visualizing intersections at a glance. Take a look at the examples to get inspired.
Venn diagram generator: key features
- Use one of the four templates to get started.
- Rotate a set around its center.
- Slide circles in and out.
- Change the brightness of the circles.
- Add a stroke to all circles.
- Unlimited sets/circles.
- Change the size for each circle separately.
- Give your sets a title and a description.
- Drag and drop circles and descriptions to reposition them.
- Highlight intersections by clicking on them.
- Optional detailed description for circles and intersections
Resources
Ready to create your own Venn diagram?
Venn Diagram: What's new?
Selecting newly created intersections now works properly again.
Dragging the labels now works properly again.
Moving circles outside of a set intersection now works as expected.
We have improved the color contrast when you change the opacity.
We have created templates for you! Select to display 2 to 5 circles arranged nicely.
Rotate and slide the circles as you wish. Change their border width and opacity.
Venn Diagram Alternatives
Enhance your productivity
Create a Venn Diagram directly in the tools you love

Create a Venn Diagram in PowerPoint with
Vizzlo's add-in

Loved by professionals around the world


Visualizations your audience won’t forget
Convey abstract concepts and data with professionally designed
charts and graphics you can easily edit and customize.