Chart Vizzard
Vizzlos KI-basierter Diagramm-GeneratorAmerica's growing debt
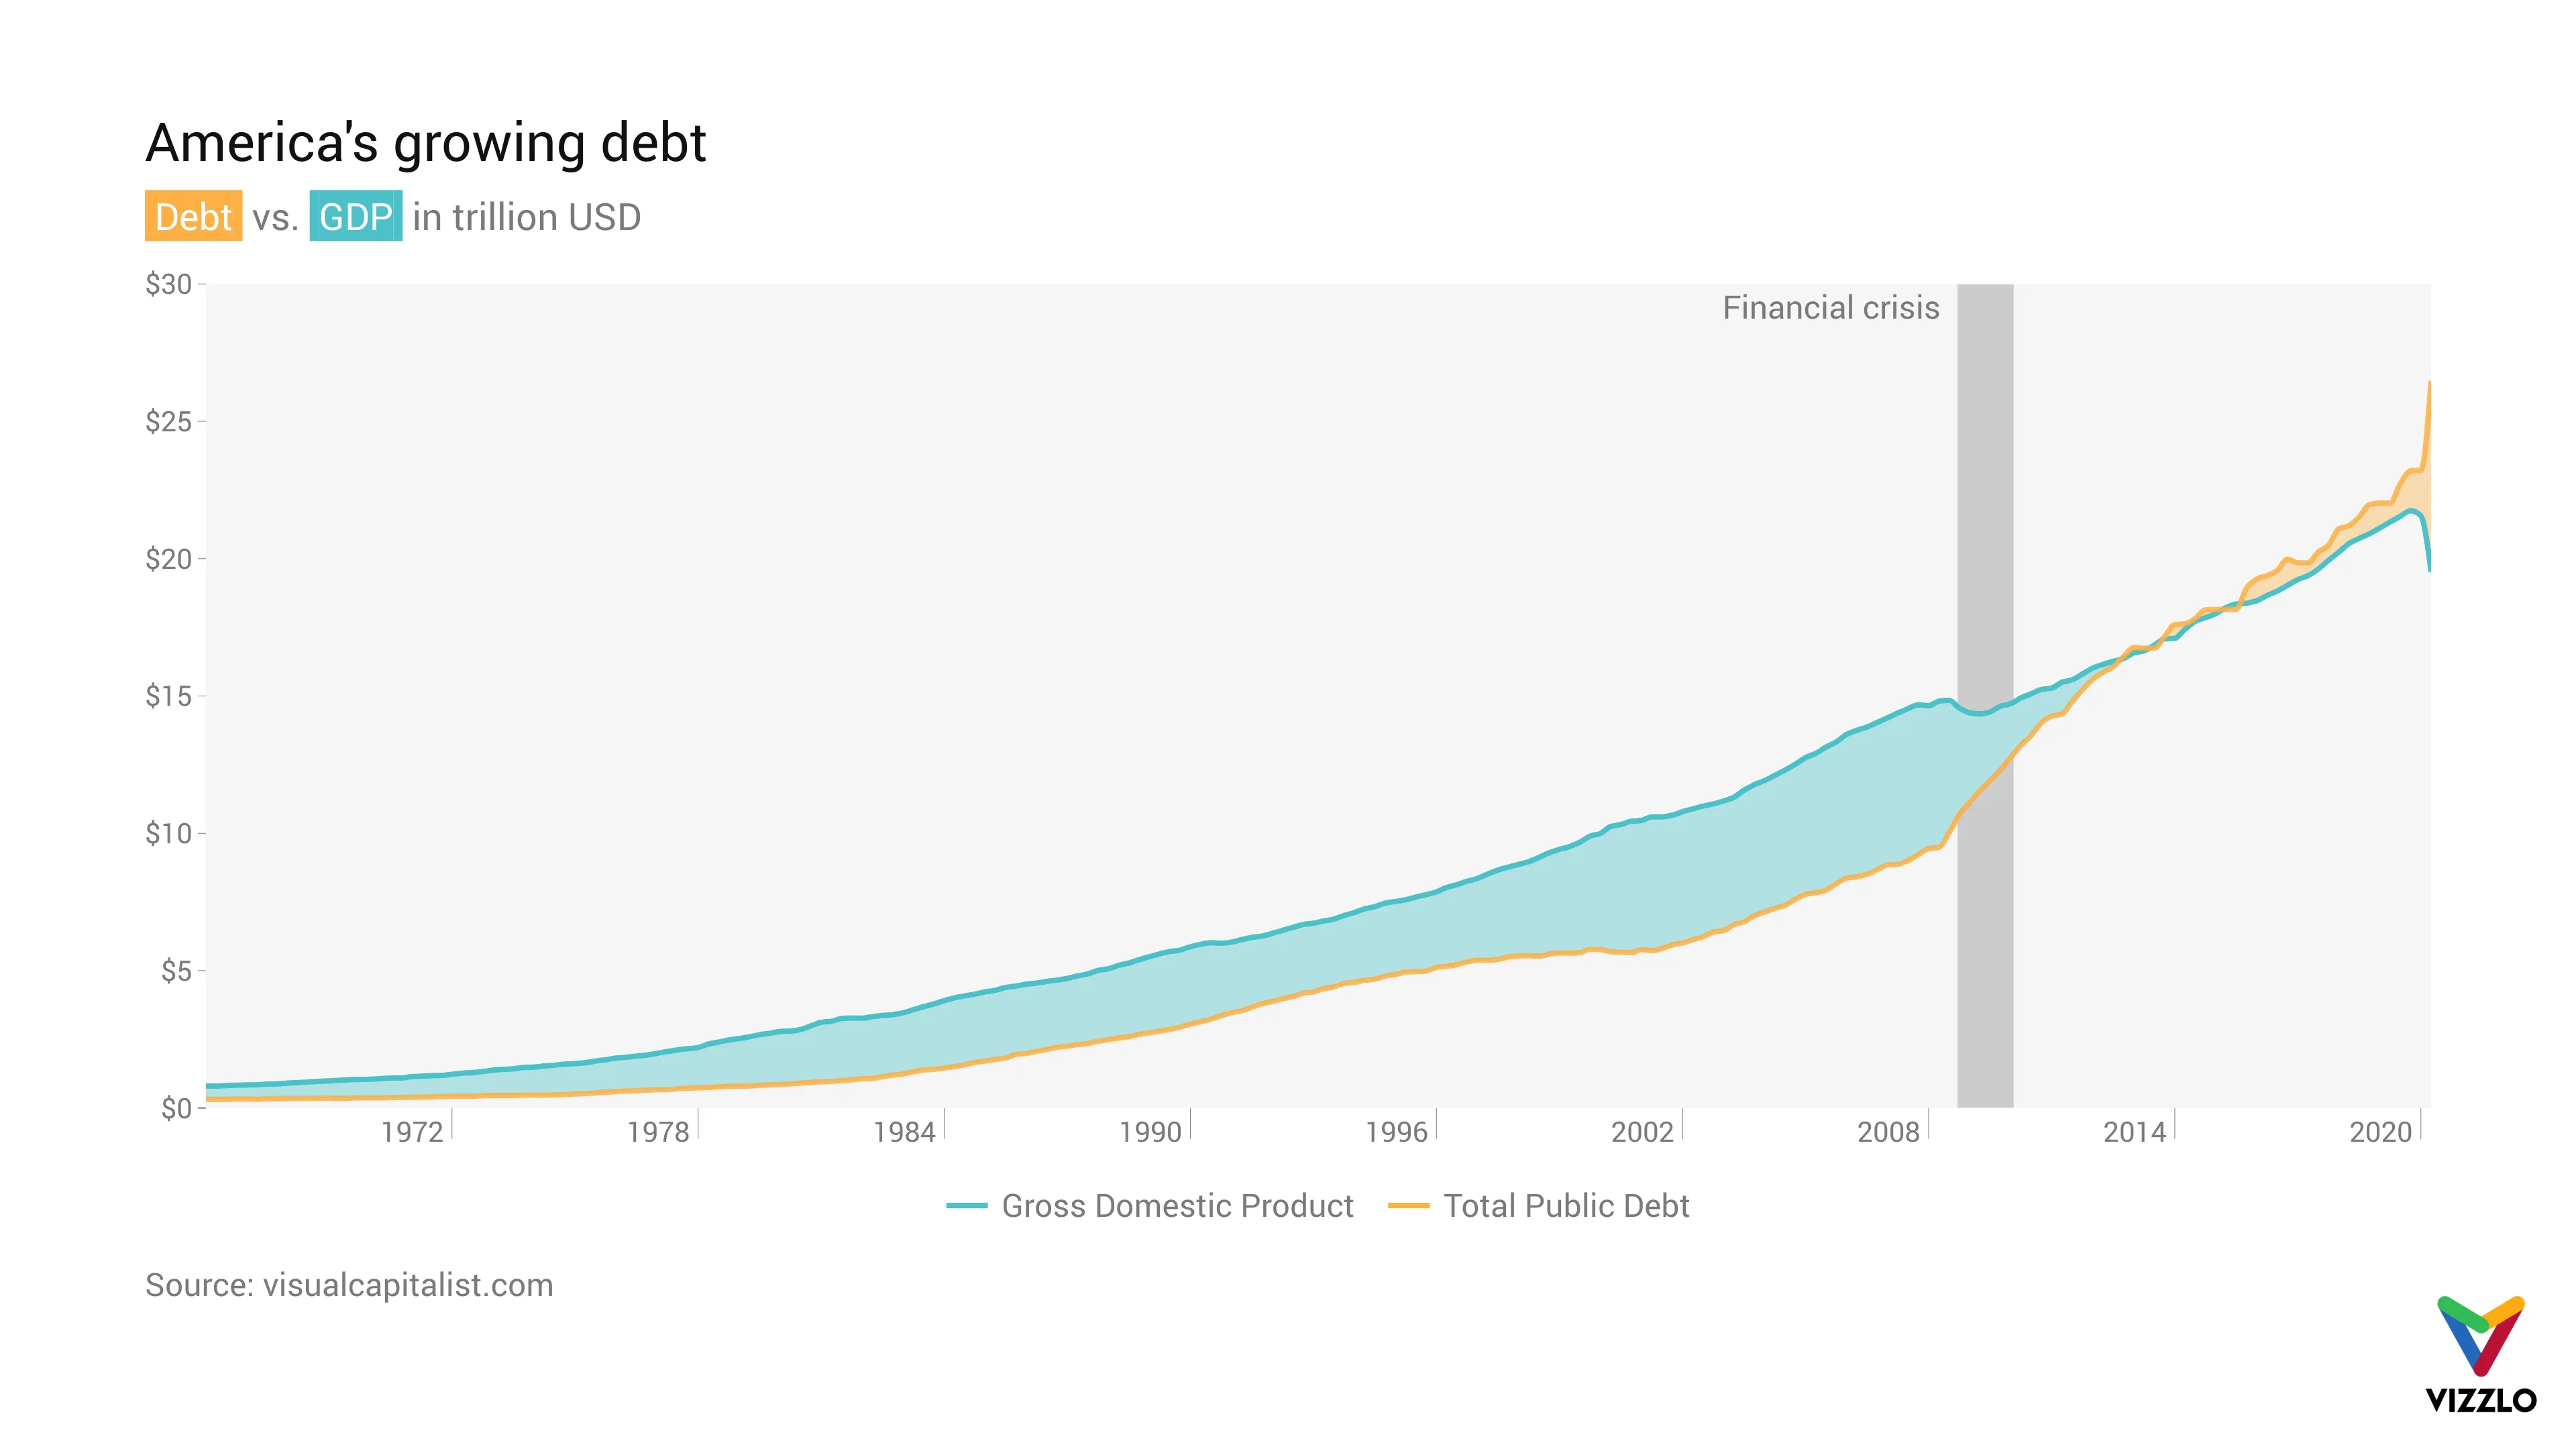
On top of this came the sharpest rise in unemployment, a slump in GDP and a sharp increase in public debt, as our chart shows.
US debt was relatively moderate at an average of 60% of GDP between 1994 and 2007. It took a drastic turn during the global financial crisis as the public debt increased to 95% of GDP by 2012.
Since then, US debt has risen even more sharply, relative to GDP. In April 2020, when the COVID-19 pandemic was in full swing, it reached a record level of 122% of GDP.
Source: visualcapitalist.com
Data: Federal Reserve, U.S. Treasury
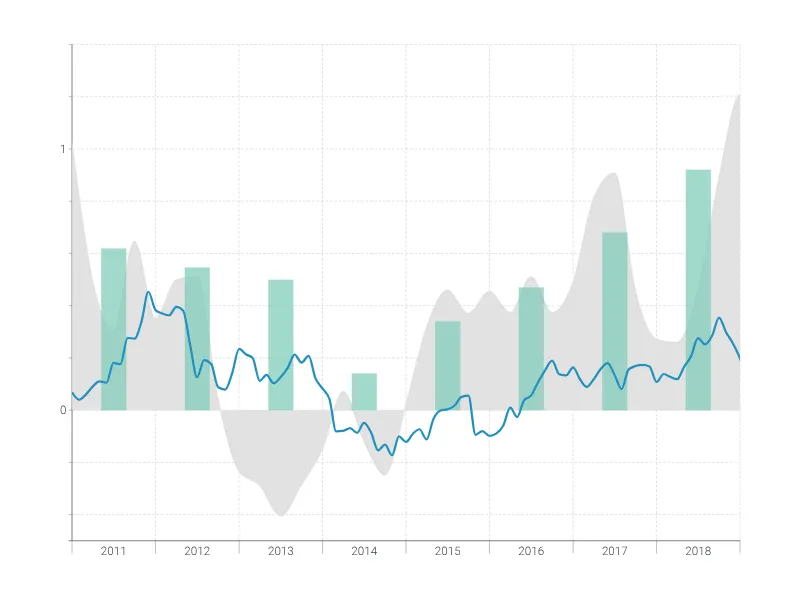
Dies ist ein Beispiel für Vizzlos "Zeitreihendiagramm"
Komplexes Zeitreihendiagramm zur Visualisierung detaillierter Finanzdaten.
Finanzen & Wirtschaft Balken- & Säulendiagramme Linien- & Flächendiagramme Zeitbasierte Diagramme