Chart Vizzard
Vizzlos KI-basierter Diagramm-GeneratorPROPORTION OF FREEMEN AND SLAVES AMONG AMERICAN NEGROES
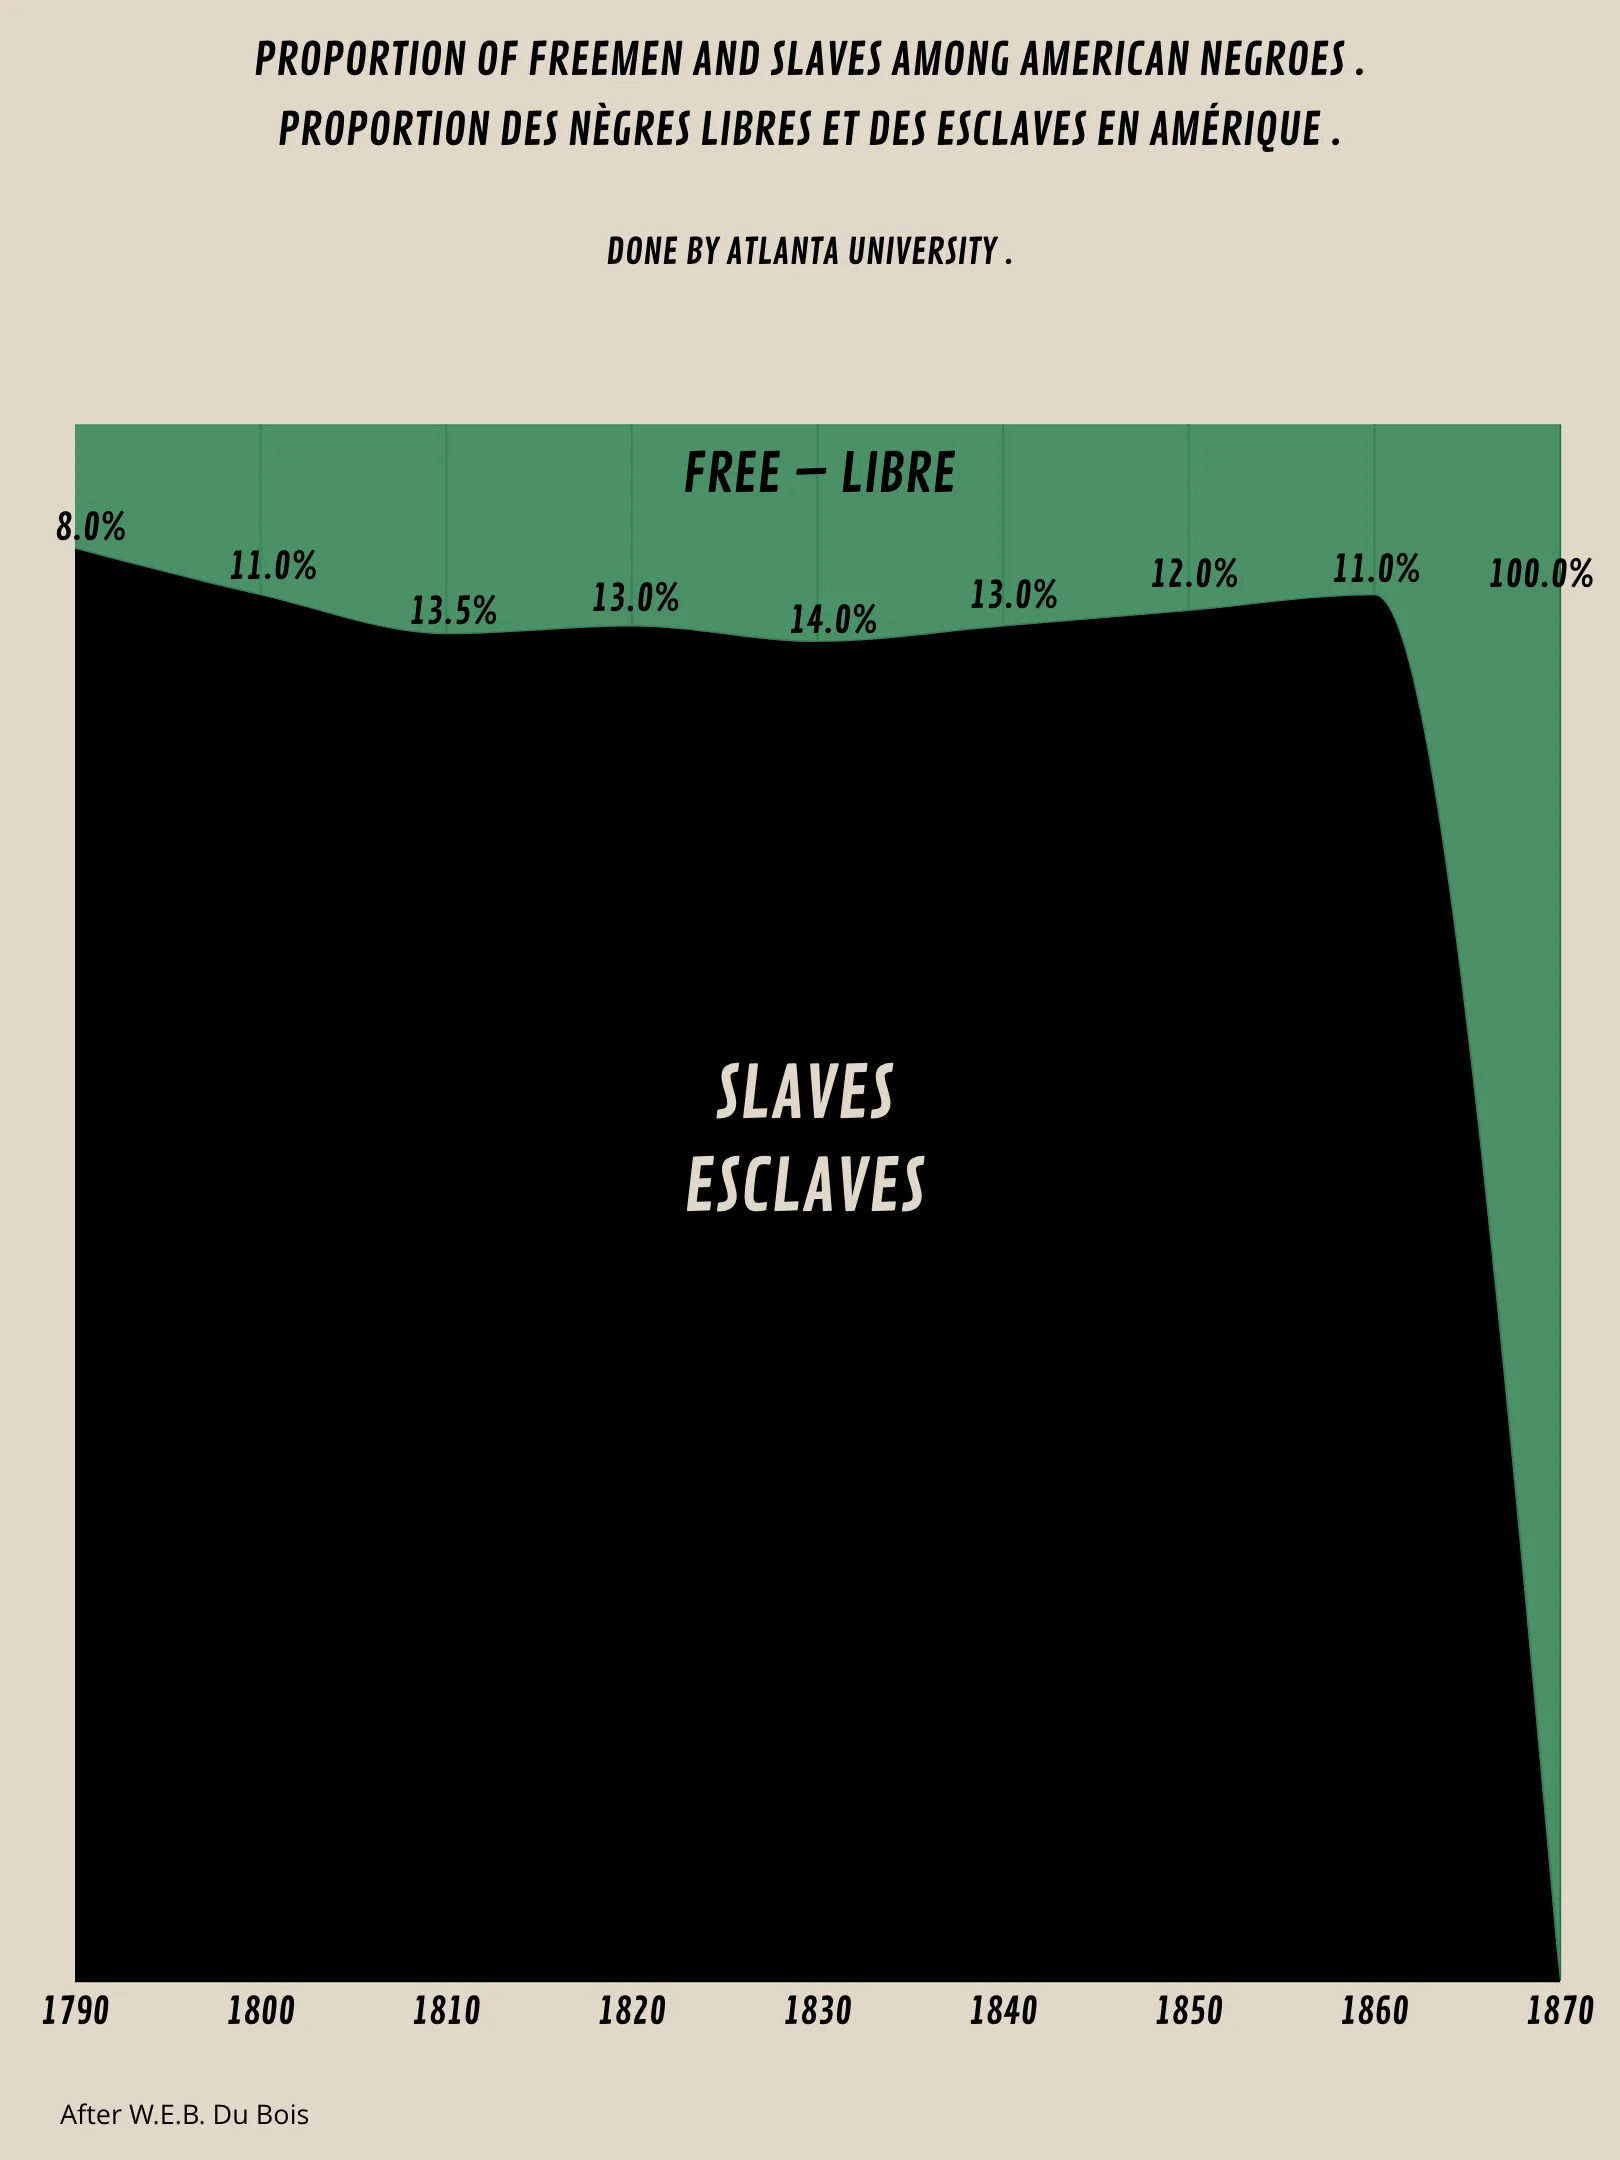
At the Exposition Universelle in Paris in 19000 creative artists showcased their work. One of which was the American social activist, sociologist, socialist, historian, civil rights activist, Pan-Africanist, author, writer and editor W.E.B. Du Bois.
His work was considered as “an attempt to give, in a systematic and compact a form as possible, the history and present condition of a large group of human beings”, as Du Bois has put it himself.
Unfortunately, the impact of the exhibition was limited and although Du Bois received a gold medal for his role as a collaborator and compiler of materials for the exhibition, the white American press did not cover it. Not wanting to give up the fight, Du Bois published his masterpiece, The Souls of Black Folk, just three years later.
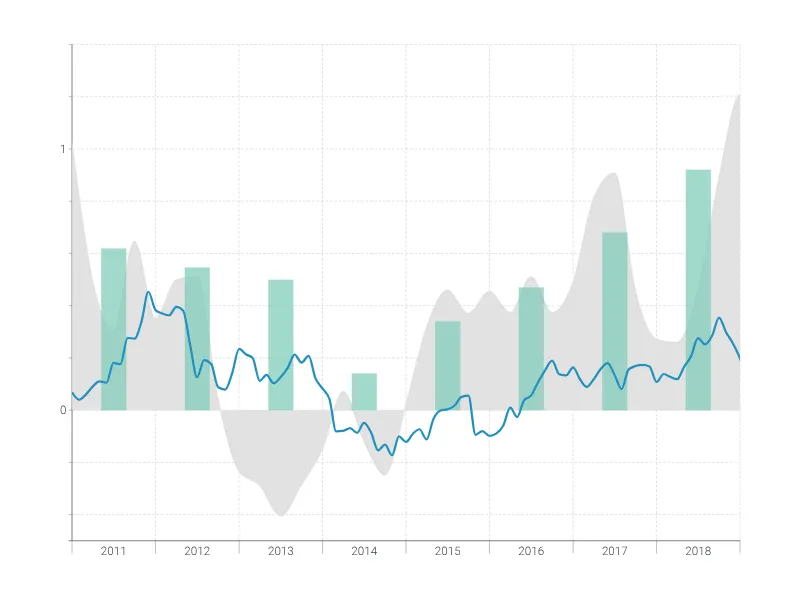
Dies ist ein Beispiel für Vizzlos "Zeitreihendiagramm"
Komplexes Zeitreihendiagramm zur Visualisierung detaillierter Finanzdaten.
Finanzen & Wirtschaft Balken- & Säulendiagramme Linien- & Flächendiagramme Zeitbasierte Diagramme