VORSCHAU
Chart Vizzard
Vizzlos KI-basierter Diagramm-GeneratorTWITCH CONCURRENT VIEWERS
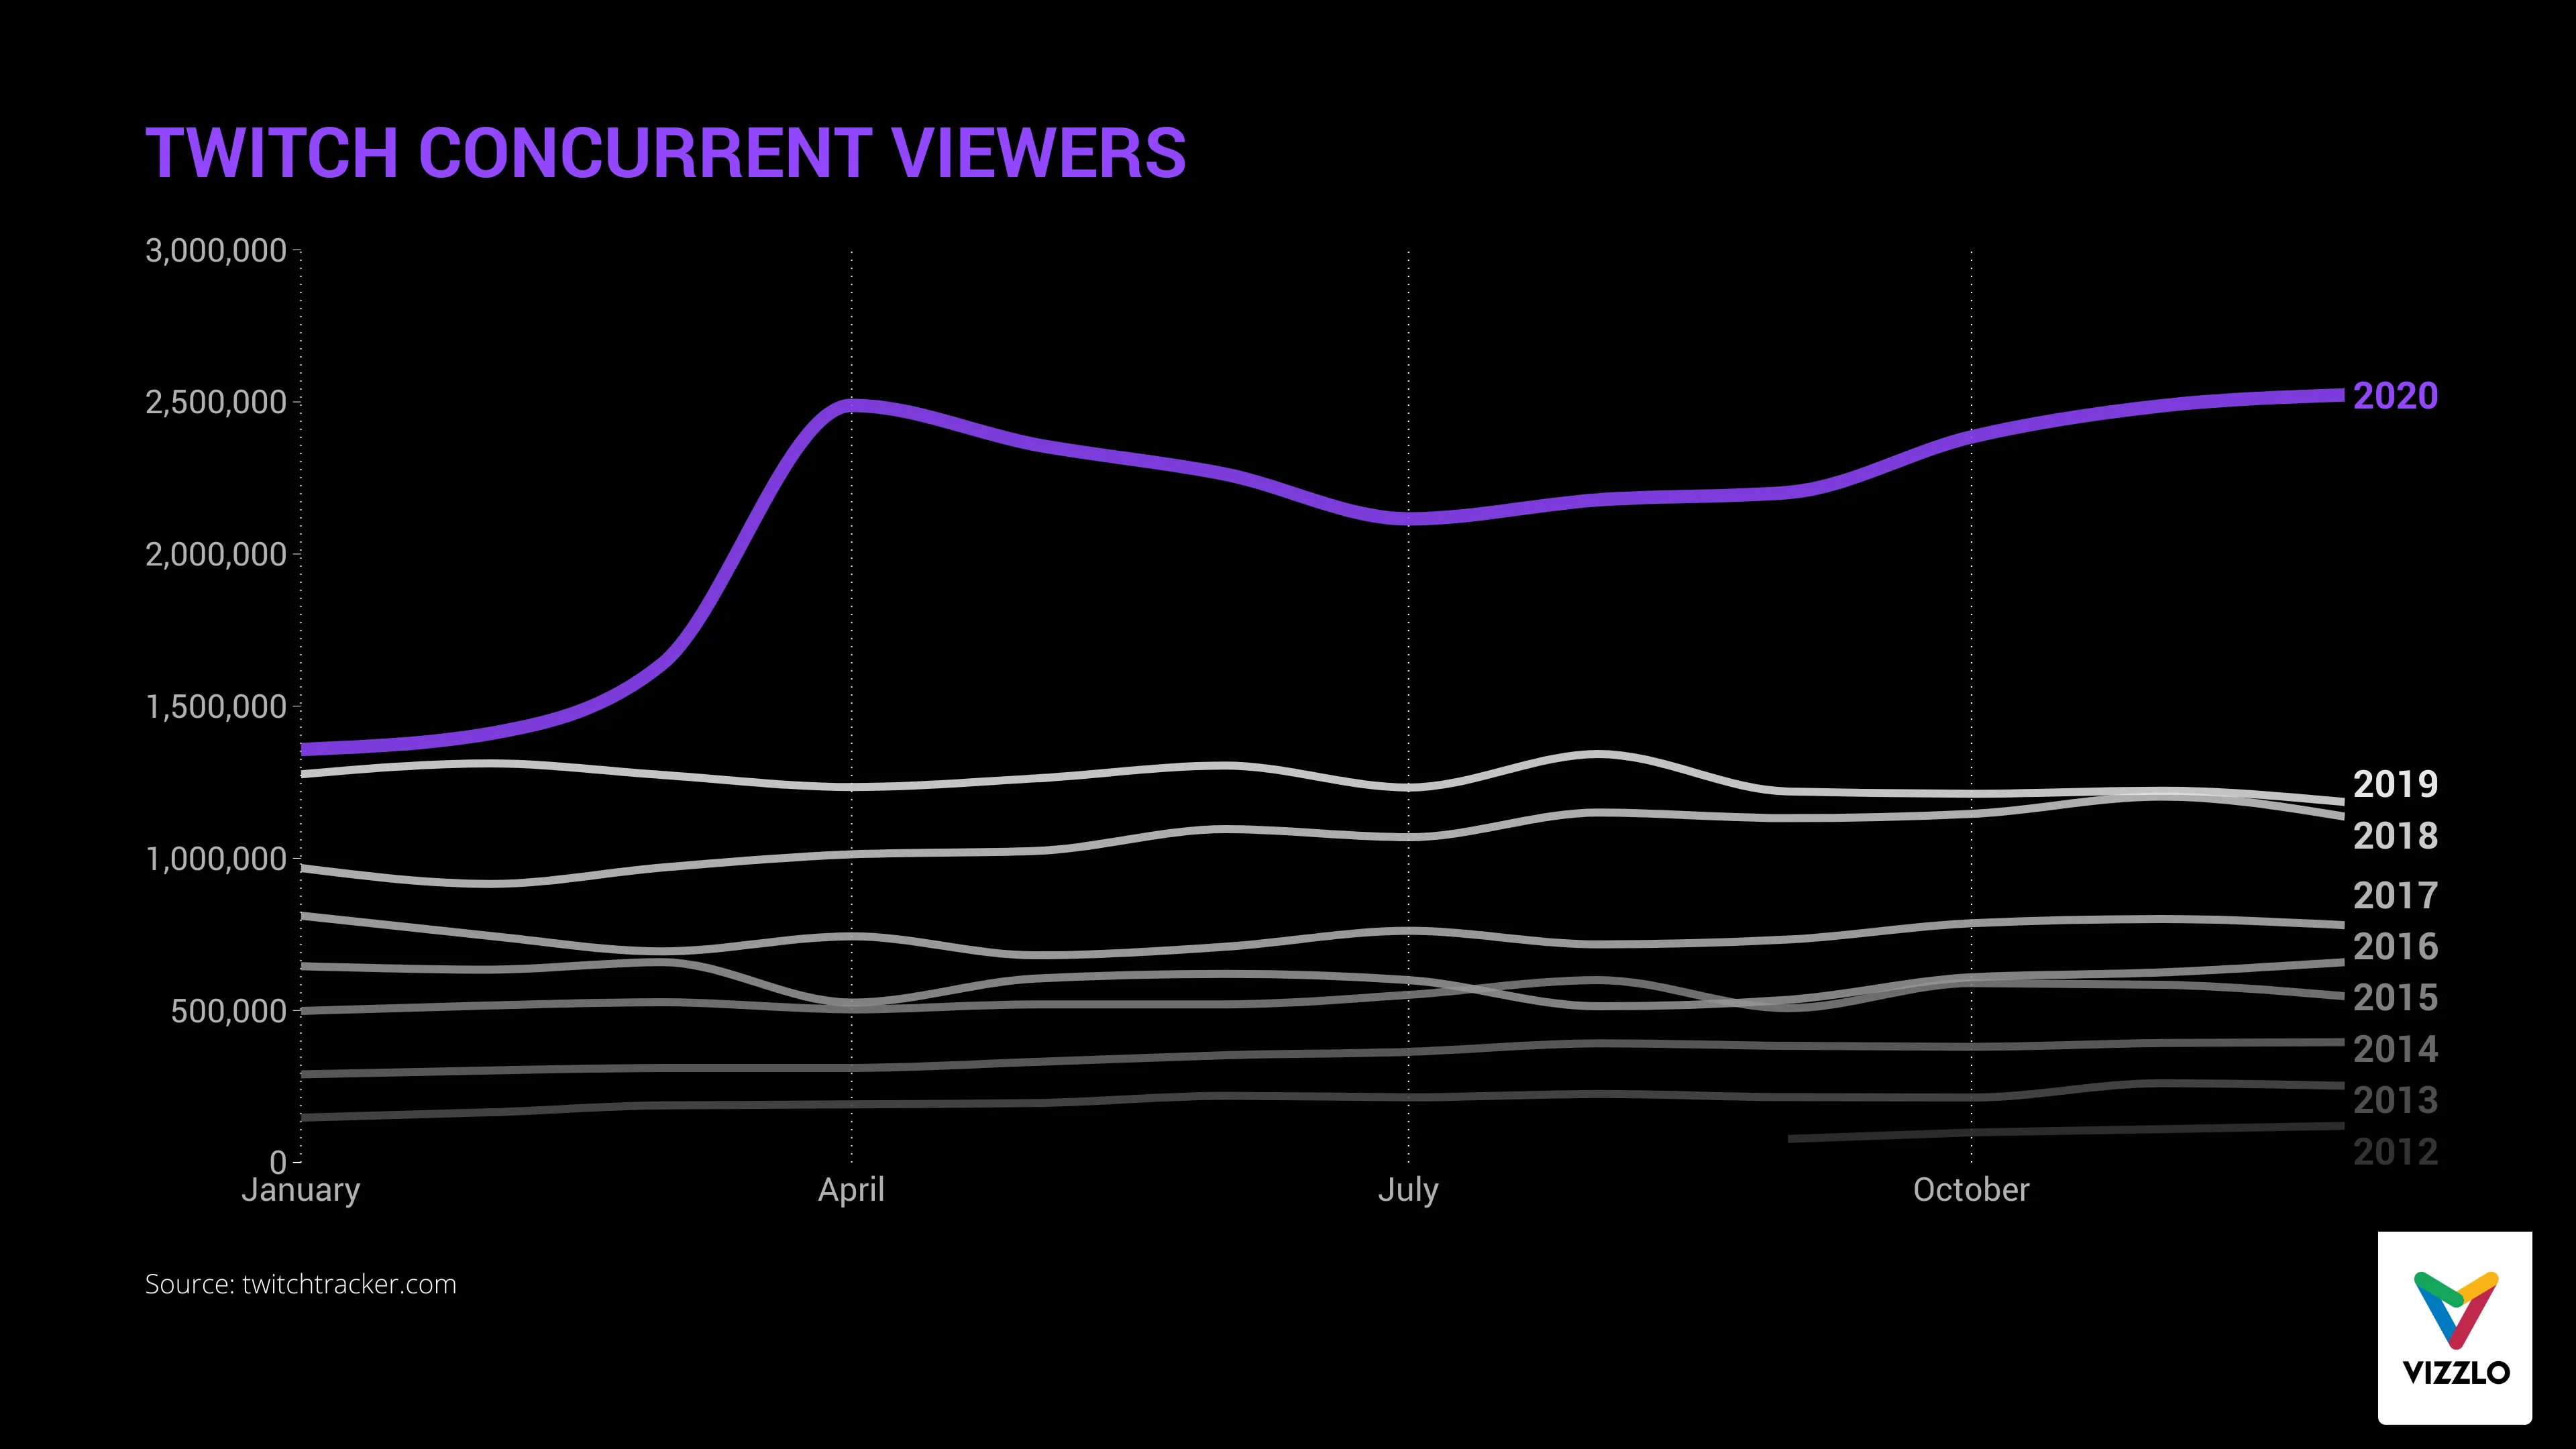
Looking back to 2020, it can be said that hardly anything was the same as before. Public life came to a standstill almost everywhere, while internet services gained massive popularity. This also applies to Twitch - a streaming platform that has doubled its user base to almost 3 million since the beginning of 2020. Especially the increase at the beginning of spring does not coincidentally coincide with the start of the pandemic.
Source: twitchtracker.com
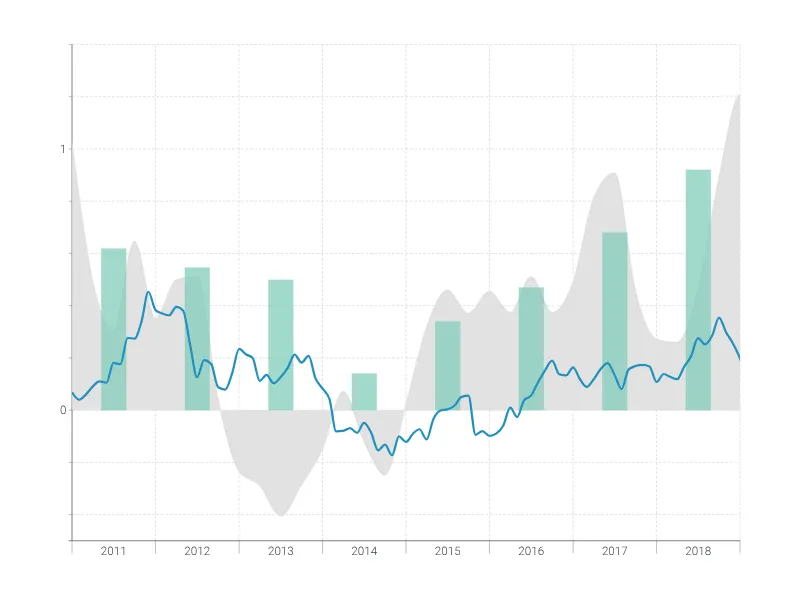
Dies ist ein Beispiel für Vizzlos "Zeitreihendiagramm"
Komplexes Zeitreihendiagramm zur Visualisierung detaillierter Finanzdaten.
Finanzen & Wirtschaft Balken- & Säulendiagramme Linien- & Flächendiagramme Zeitbasierte Diagramme