Chart Vizzard
Vizzlo's AI-based chart generatorTWITCH CONCURRENT VIEWERS

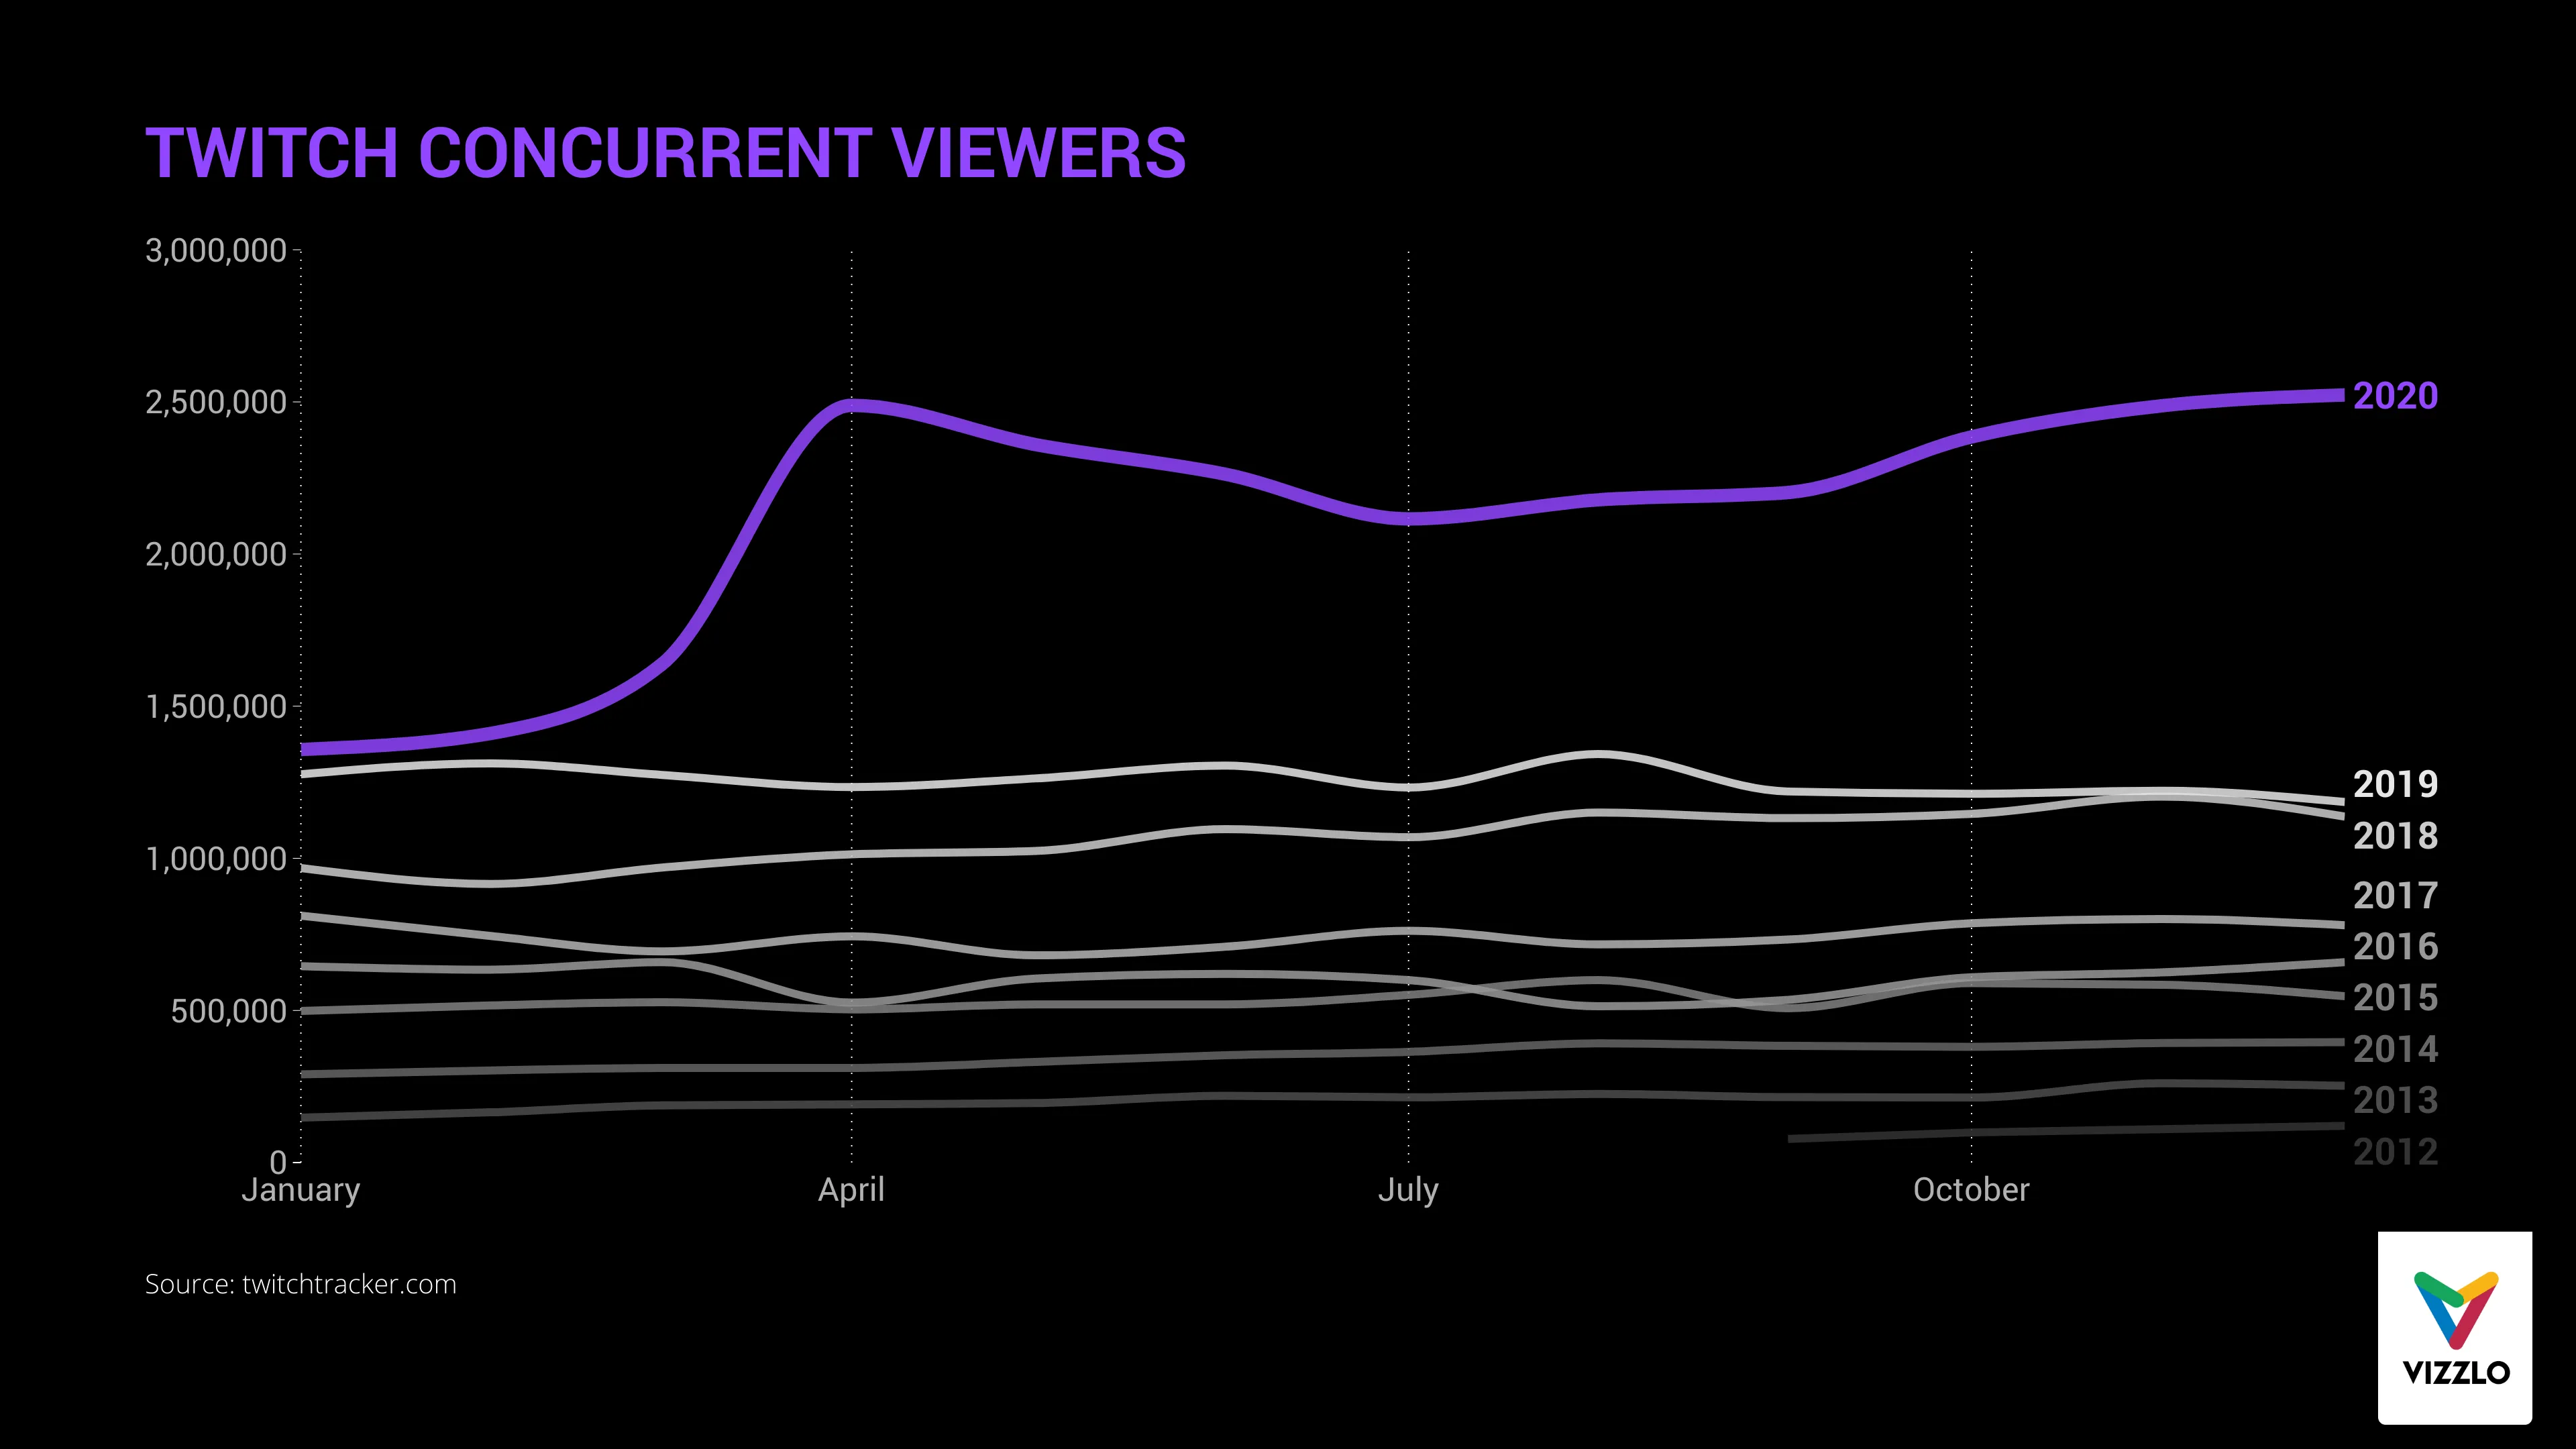
Looking back to 2020, it can be said that hardly anything was the same as before. Public life came to a standstill almost everywhere, while internet services gained massive popularity. This also applies to Twitch - a streaming platform that has doubled its user base to almost 3 million since the beginning of 2020. Especially the increase at the beginning of spring does not coincidentally coincide with the start of the pandemic.
Source: twitchtracker.com

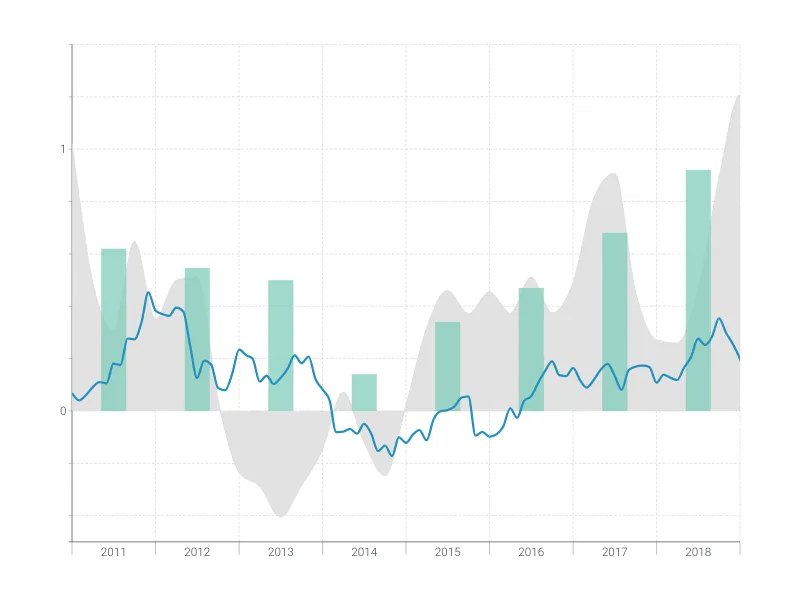
This is an example of Vizzlo's “Time Series Graph”
Complex time series graph to visualize detailed financial data.
Finance & Economics Bar & Column charts Line & Area charts Time-based charts