VORSCHAU
Chart Vizzard
Vizzlos KI-basierter Diagramm-GeneratorUS stock market expectations
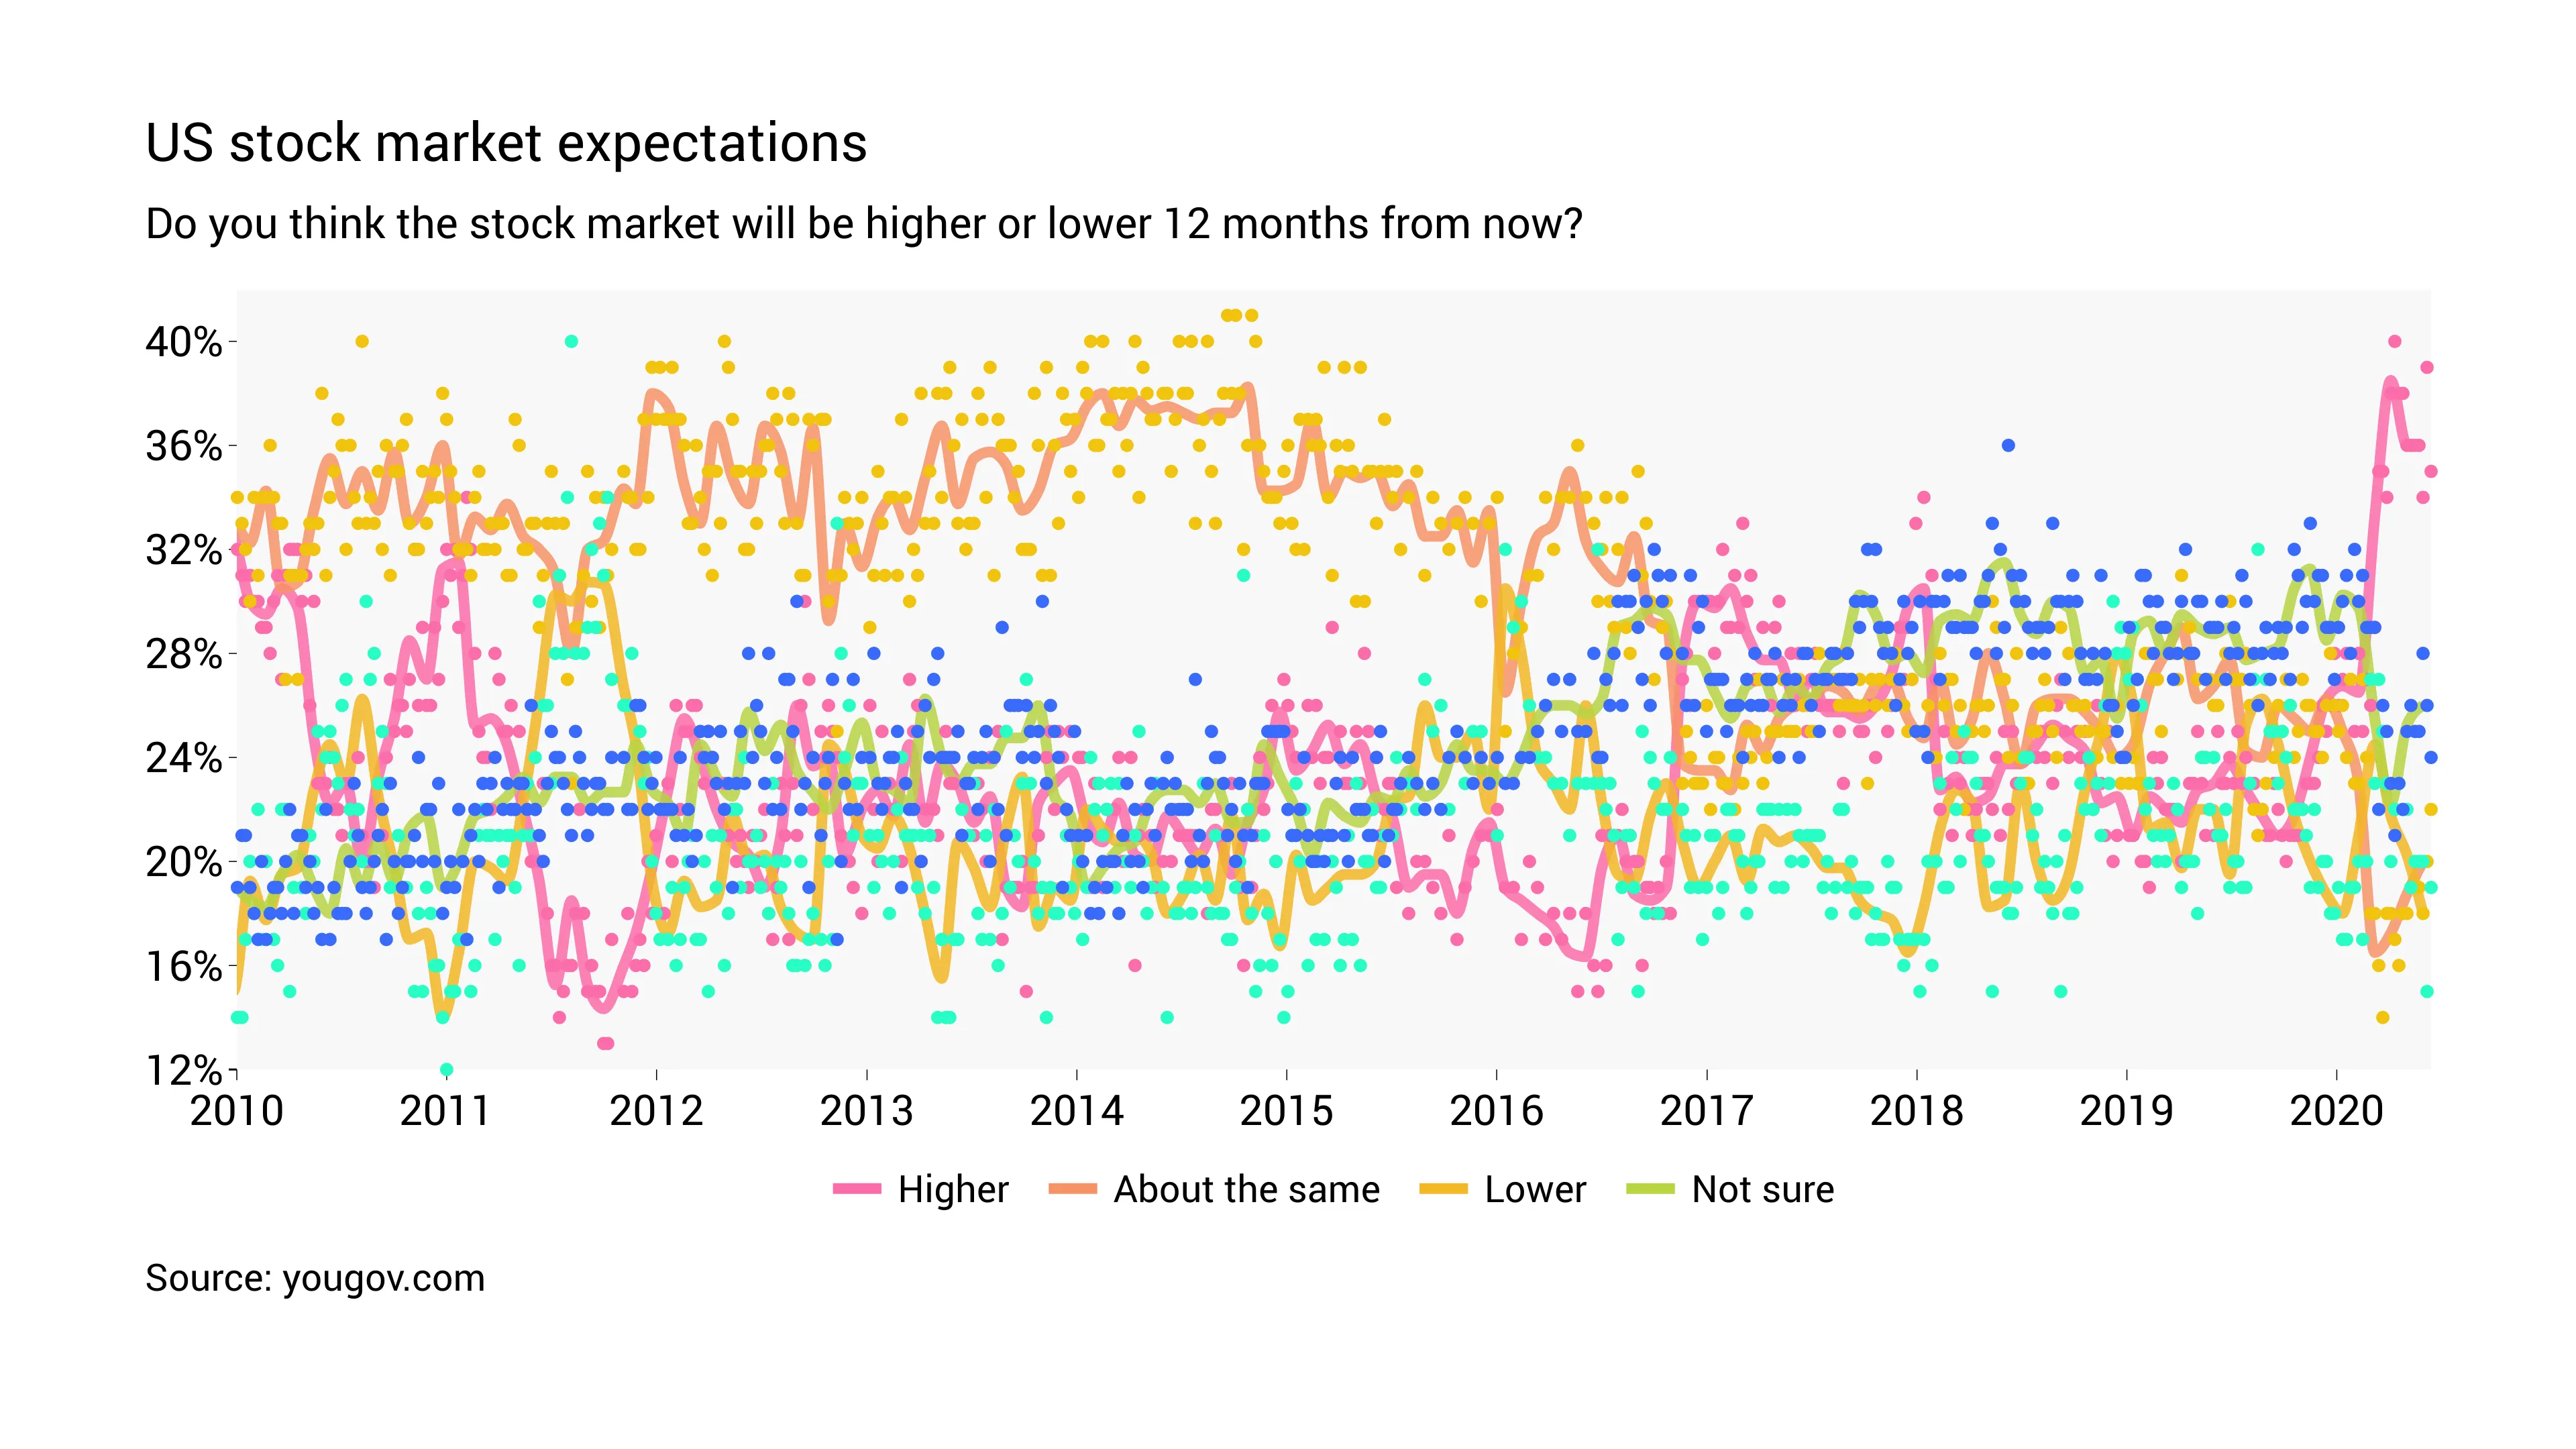
Expectations play a key role in economic forecasting and hence, in economic decision-making. London based research data and analytics group YouGov collects survey data about the expected US stock market in 12 month time.
The data are collected weekly and are shown as points in the graph. We chose to add a moving average of a four-week window to highlight the signal and reduce noise.
Source: yougov.com, data was last update: June 18, 2020
Dies ist ein Beispiel für Vizzlos "Zeitreihendiagramm"
Komplexes Zeitreihendiagramm zur Visualisierung detaillierter Finanzdaten.
Finanzen & Wirtschaft Balken- & Säulendiagramme Linien- & Flächendiagramme Zeitbasierte Diagramme