PREVIEW
Chart Vizzard
Vizzlo's AI-based chart generatorUS stock market expectations

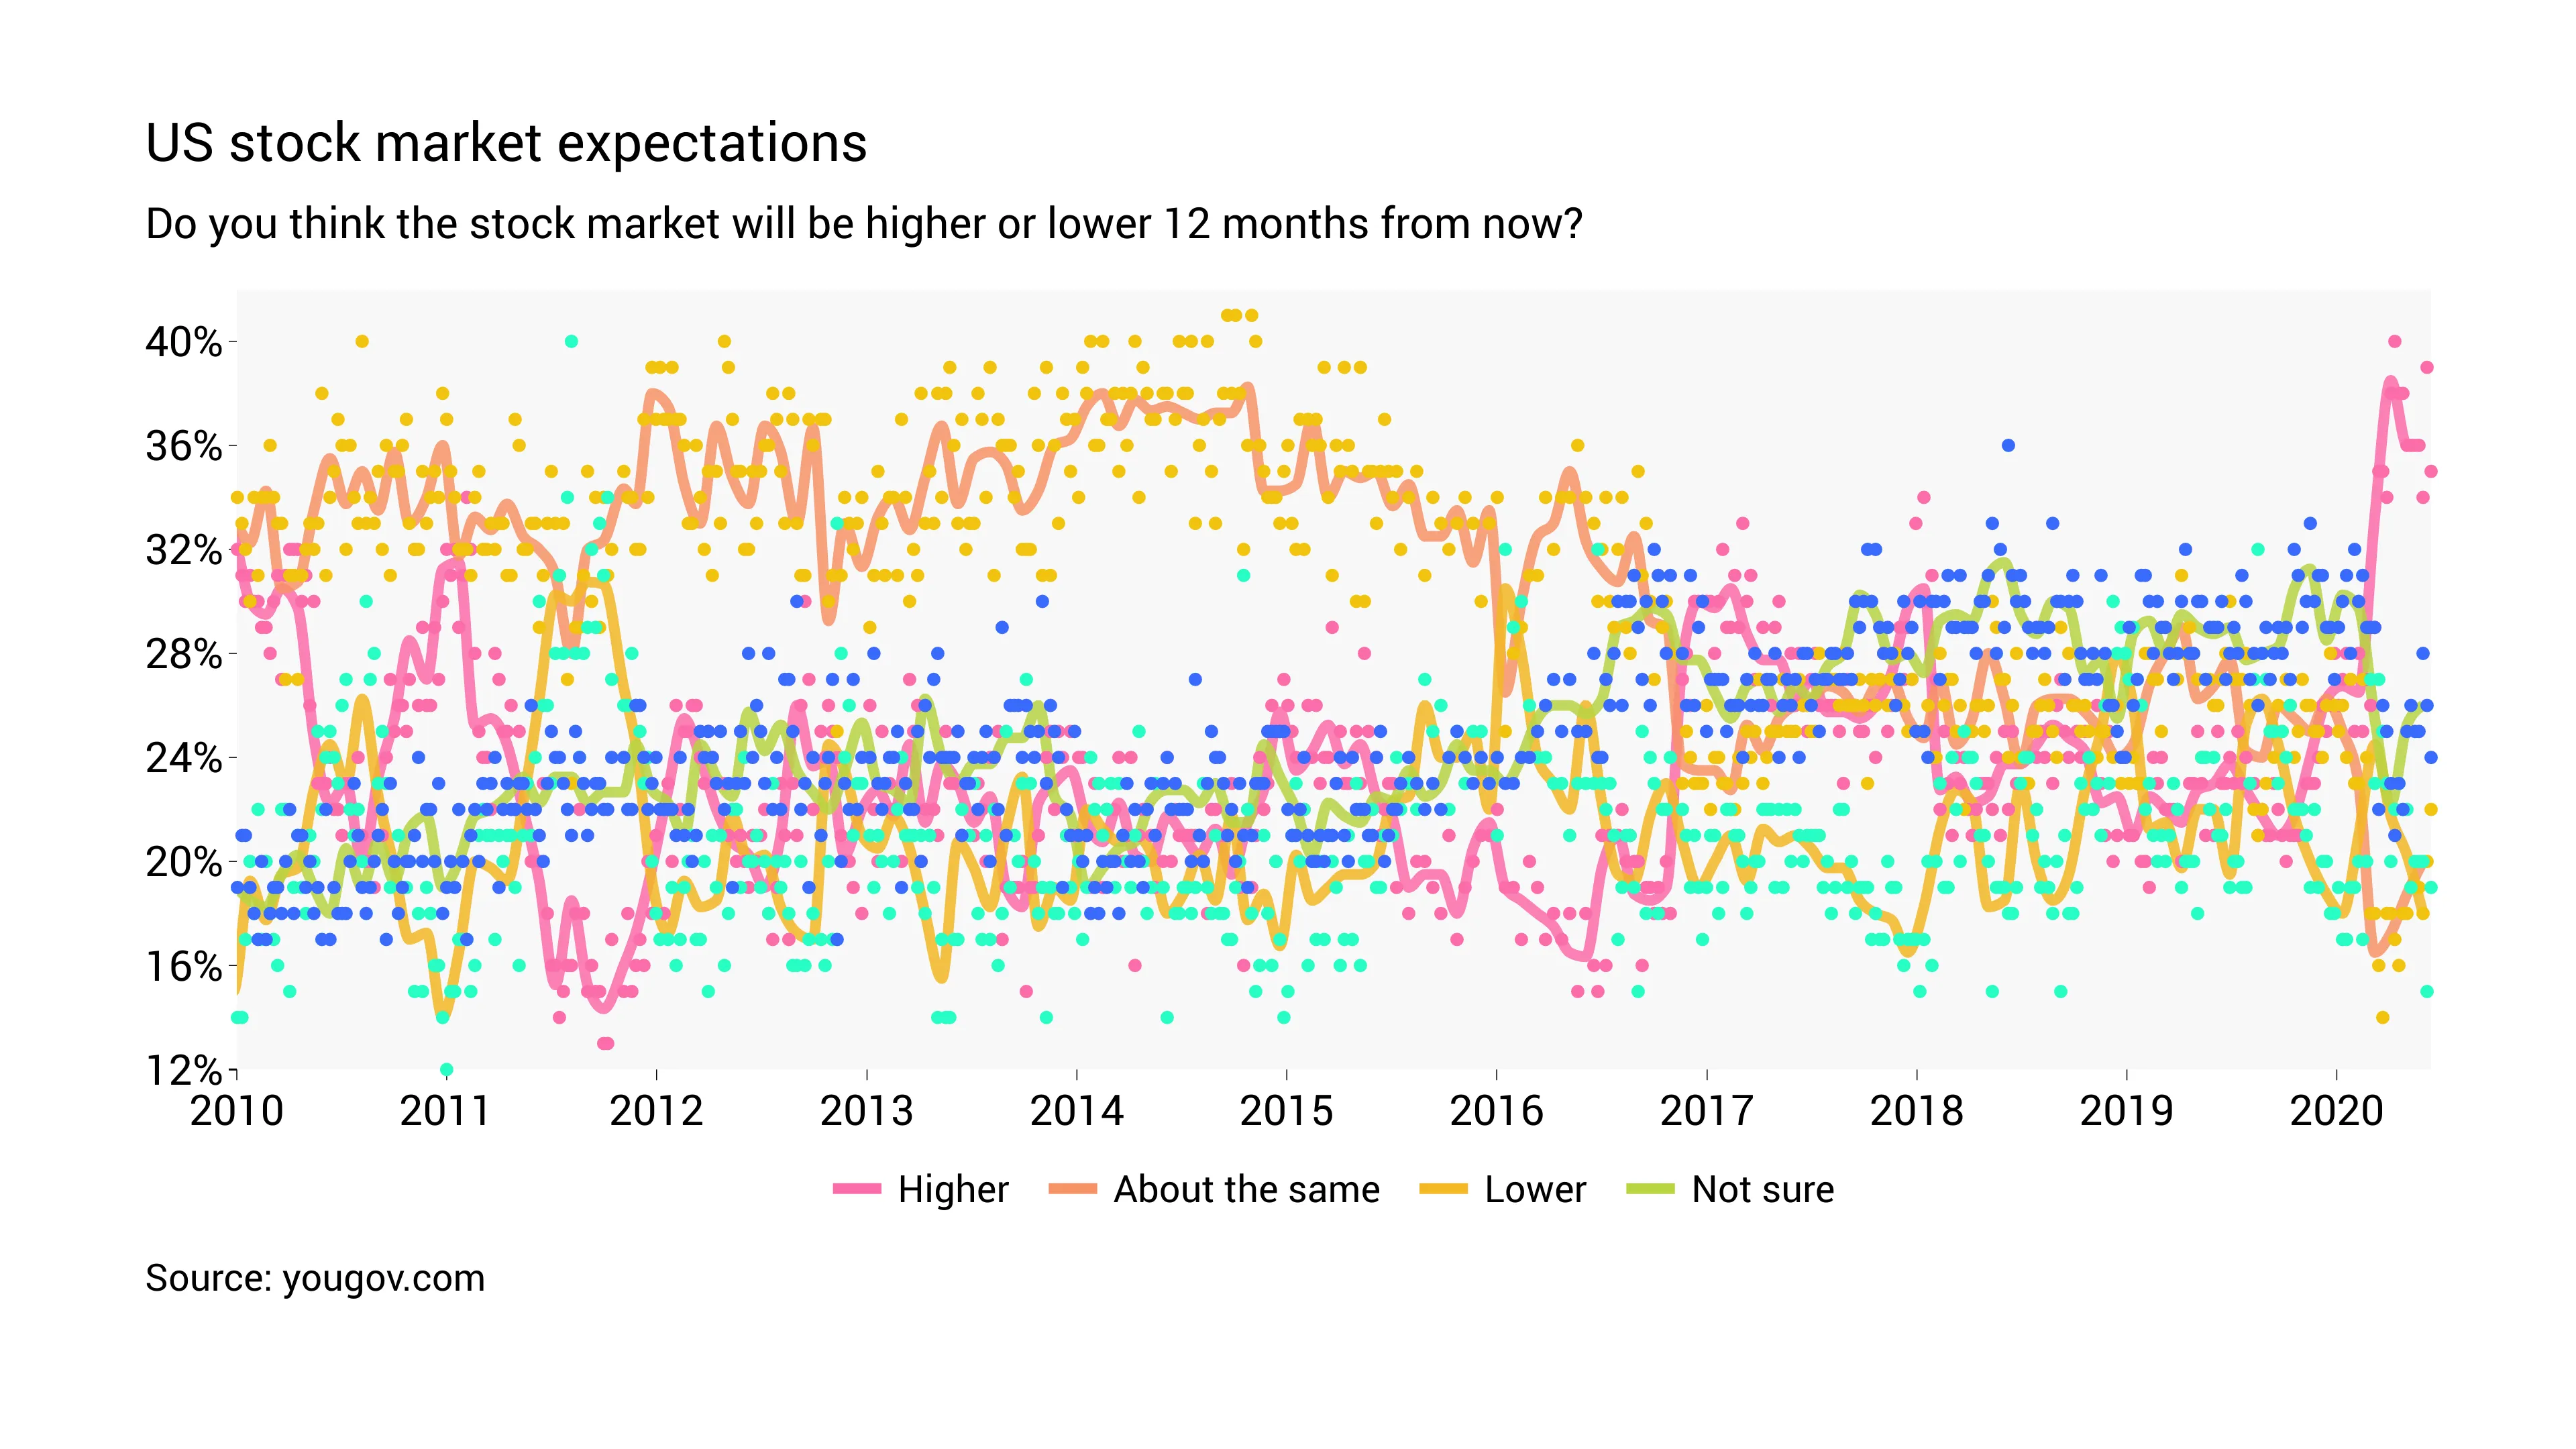
Expectations play a key role in economic forecasting and hence, in economic decision-making. London based research data and analytics group YouGov collects survey data about the expected US stock market in 12 month time.
The data are collected weekly and are shown as points in the graph. We chose to add a moving average of a four-week window to highlight the signal and reduce noise.
Source: yougov.com, data was last update: June 18, 2020

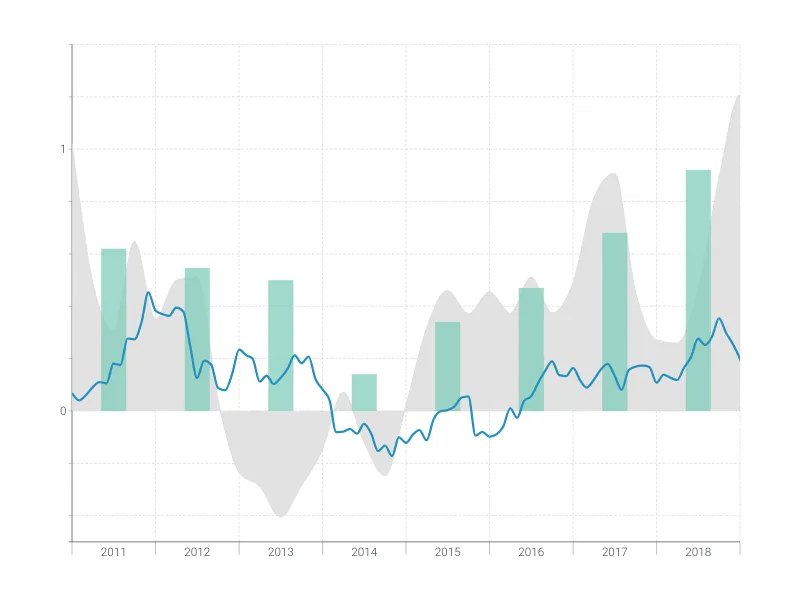
This is an example of Vizzlo's “Time Series Graph”
Complex time series graph to visualize detailed financial data.
Finance & Economics Bar & Column charts Line & Area charts Time-based charts