Chart Vizzard
Vizzlo's AI-based chart generatorU.S. Map
A zoomable map of the United States for highlighting any number of states by clicking on them.
What is a U.S. map?
The us map is a political map of the United States that shows the official borders of states and their location.
Communicating through a map is more visually compelling and informative than showing lists or flags. It provides a broader context to your audience/readers, i.e., how diffused, concentrated, widespread your subject is.
Add a map of the United States to your presentation slides with precisely the information you want to show, by using Vizzlo’s integrations to PowerPoint and Google Slides.
Best uses for the U.S. map
- Showcasing the states where your company operates
- Highlighting the states relevant to your data
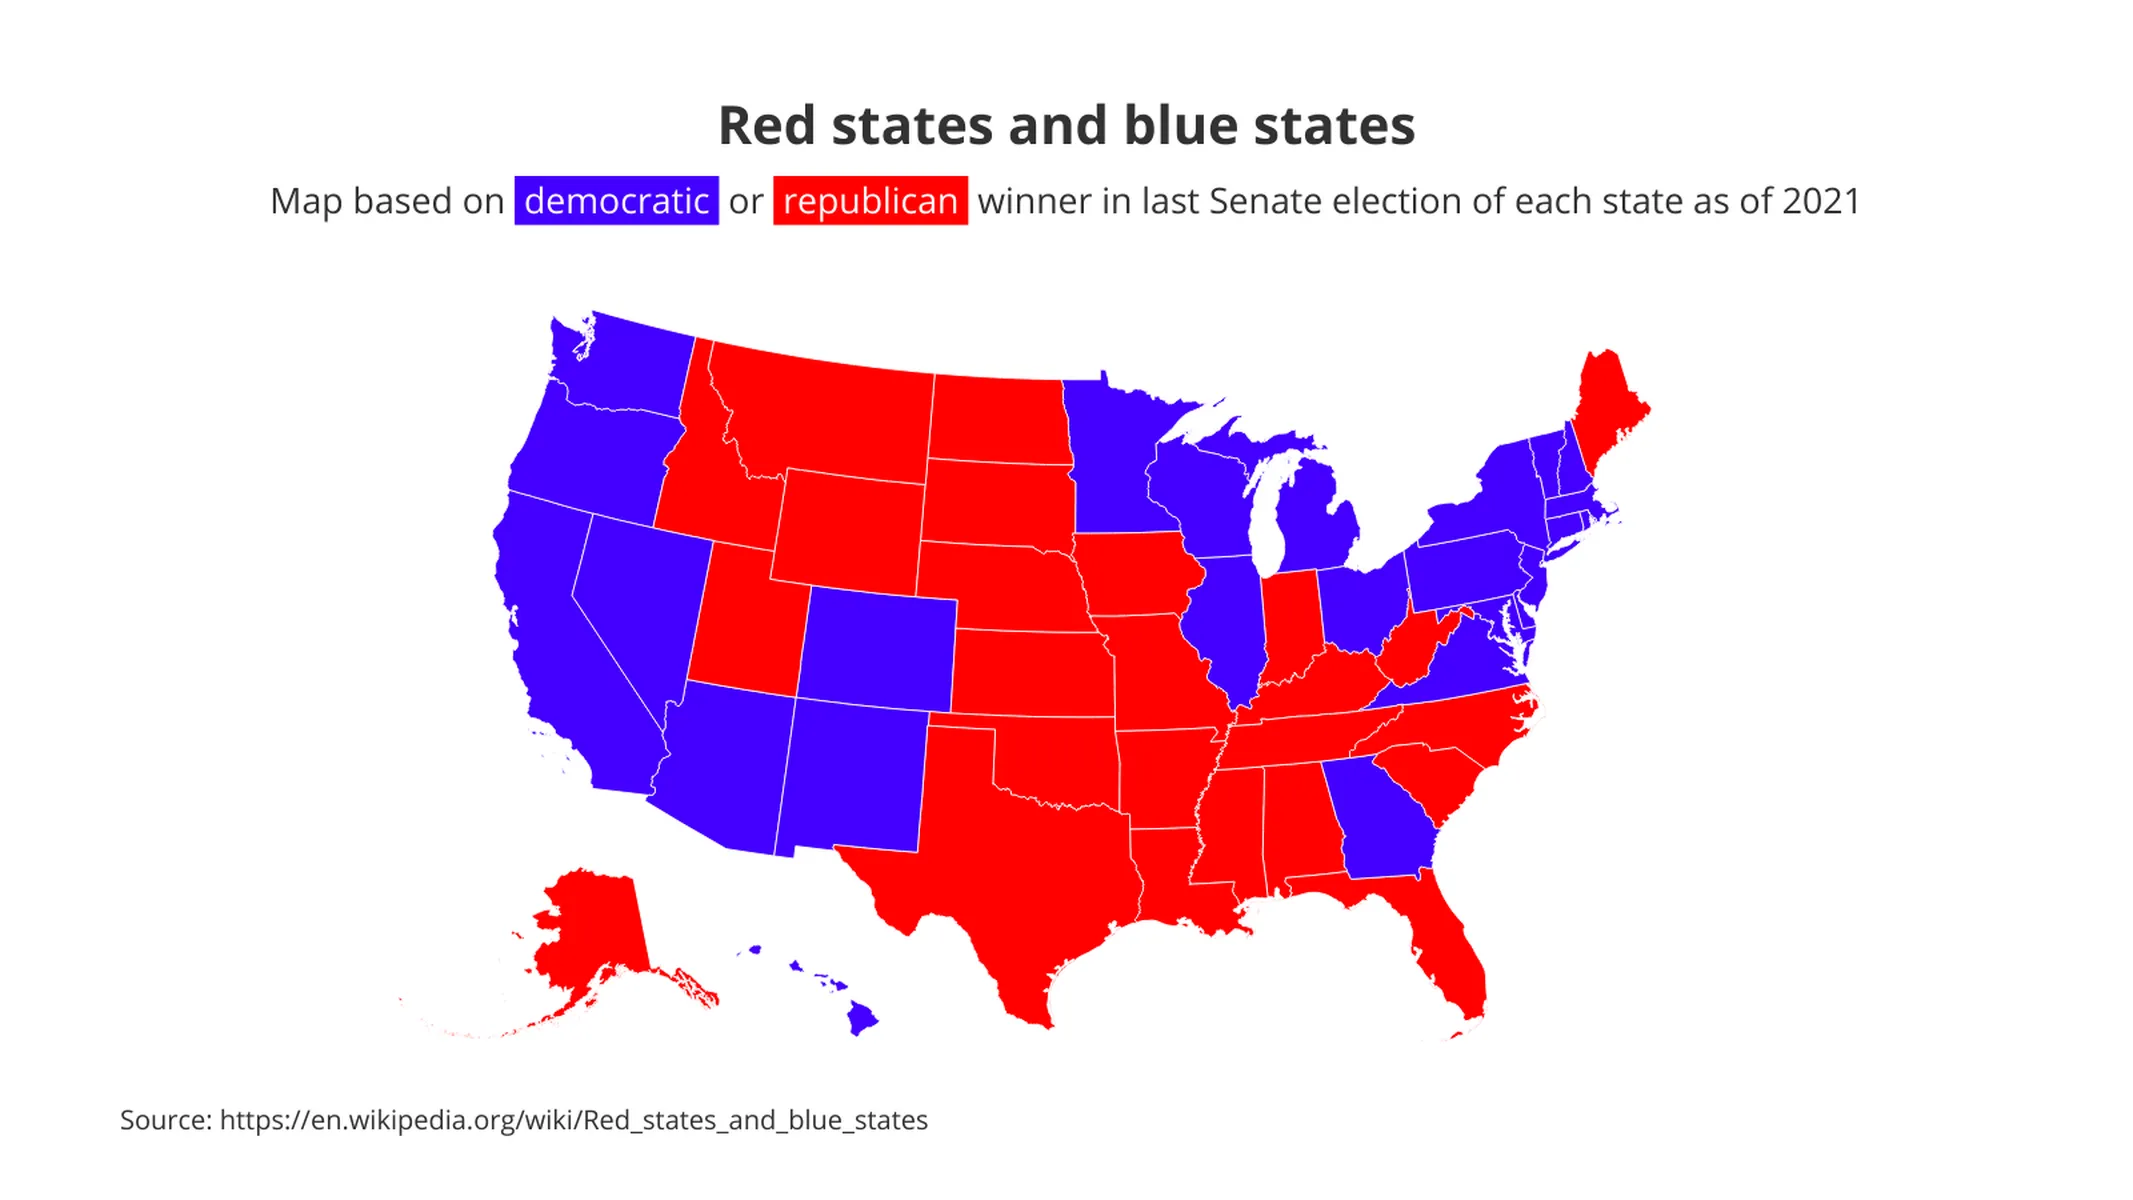
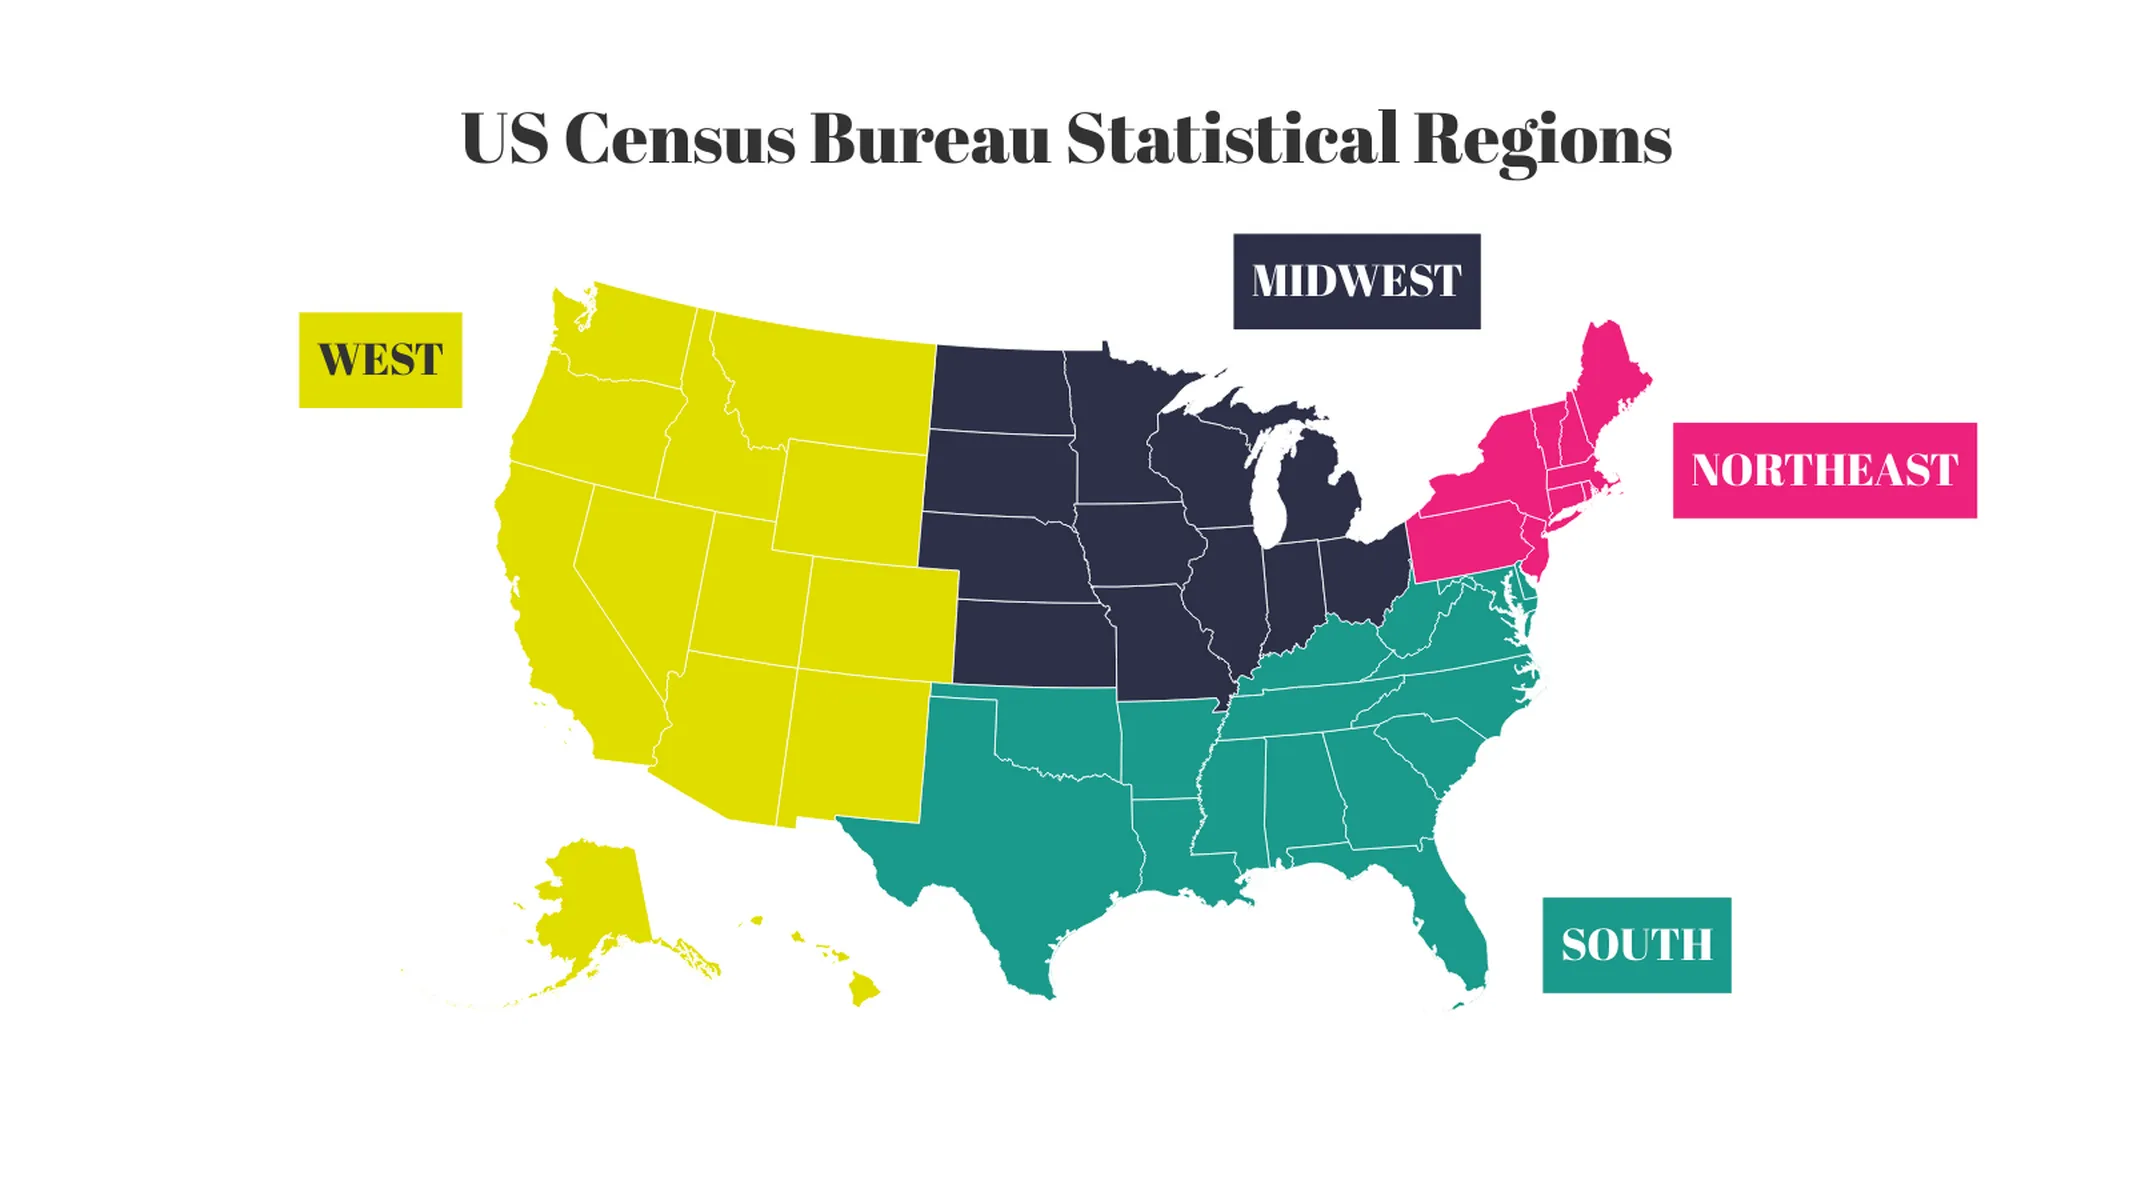
- Visualizing region-based research using color coding
How to make a U.S. map with Vizzlo?
Create a great-looking U.S. map in seconds. Follow these easy steps:
- Click on a state to highlight it, or look for its name in the search field under “Layout Settings”
- Frame a specific region by using the “Zoom Level” slider; click and drag the map around to position it as you wish
- By selecting any state you can summon its active card and assign individual colors to your liking
U.S. map: pro tips
- Use annotations to add customizable text fields and lines to make a complete visual presentation of your data
U.S. map maker: key features
- Custom colors and fonts
- Optional labeling of individual elements
- Custom document formats
U.S. Map: What's new?
We now offer a map of the United States of America!
Enhance your productivity
Create a U.S. Map directly in the tools you love

Create a U.S. Map in PowerPoint with
Vizzlo's add-in
Loved by professionals around the world


Visualizations your audience won’t forget
Convey abstract concepts and data with professionally designed
charts and graphics you can easily edit and customize.


