PREVIEW
Chart Vizzard
Vizzlo's AI-based chart generatorVizzlo for Google Slides
Harness the power of 120+ charts right from your presentation

Boost your productivity and give that "WOW" factor to your presentations with a single add-on
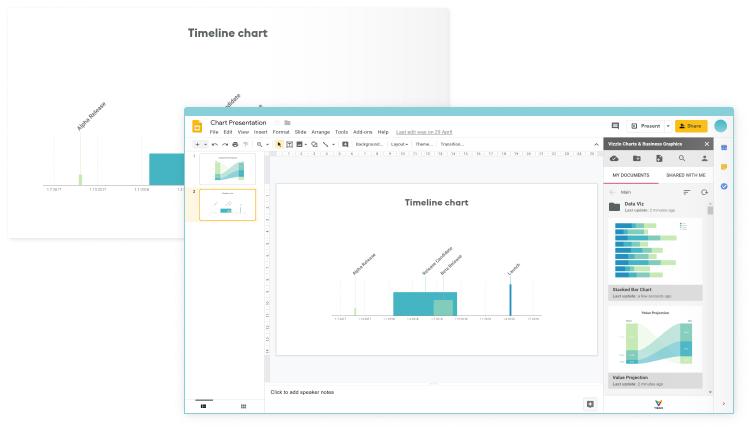
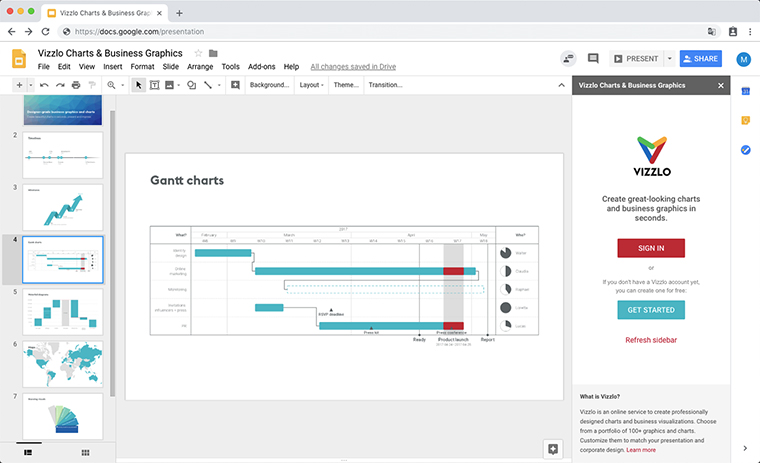
Vizzlo is proud to bring its full power to create stunning presentations to Google Slides.
Quickly create engaging Gantt charts, timelines and
data-driven graphs in Google Slides

+
- 100% browser-based
- Work on personal or shared documents
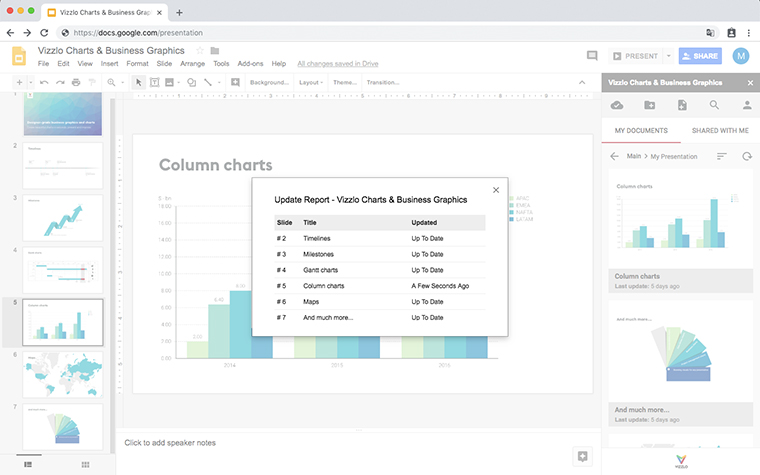
- Keep your presentation updated
- Create, customize and edit charts with ease
- Enjoy Vizzlo's versatile portfolio
Learn about the advantages and how to use Vizzlo's powerful add-on in the Help Center.
How to integrate Vizzlo into Google Slides
It is as quick to install, as it is easy to use:
-
1. Open Google Slides and select the "Add-ons" tab
-
2. Click on "Get-add-ons..."
-
3. Type "Vizzlo" in the search bar
-
4. Click on "Free" once you have found the add-on

