Chart Vizzard
Vizzlo's AI-based chart generatorCoordinate your team better

Increase success, improve your project communication
That's not new: the lack of communication is one of the most common causes leading to project failure.
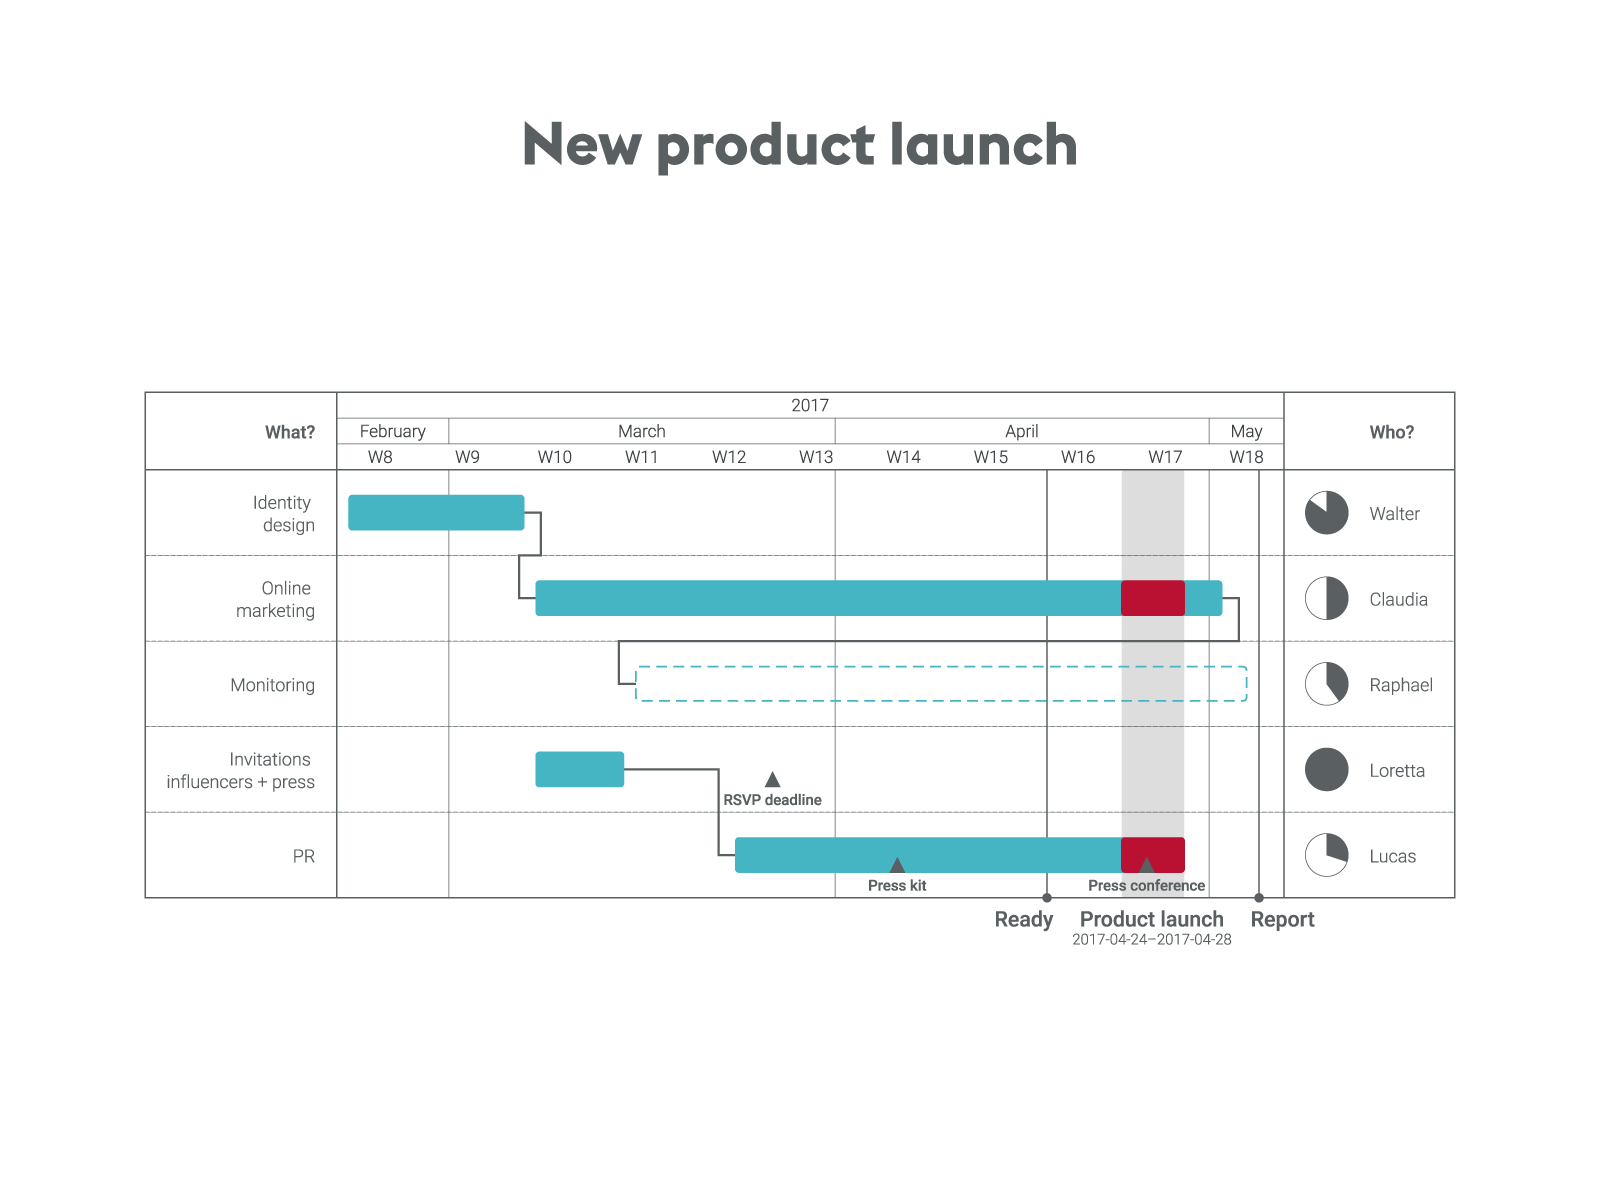
Successful project communication starts with a clear visualization of your project scope and goals. Therefore, powerful project presentations—either to senior executives, to your project team, or to external stakeholders—have a strategic meaning, helping to communicate milestones, keep track of the project status, and achieve collective objectives. Furthermore, they're motivating!
Vizzlo's business charts and graphics are straight to the point, professionally designed and very easy to create. They're the perfect visual aids to communicate effectively and deliver outstanding presentations.
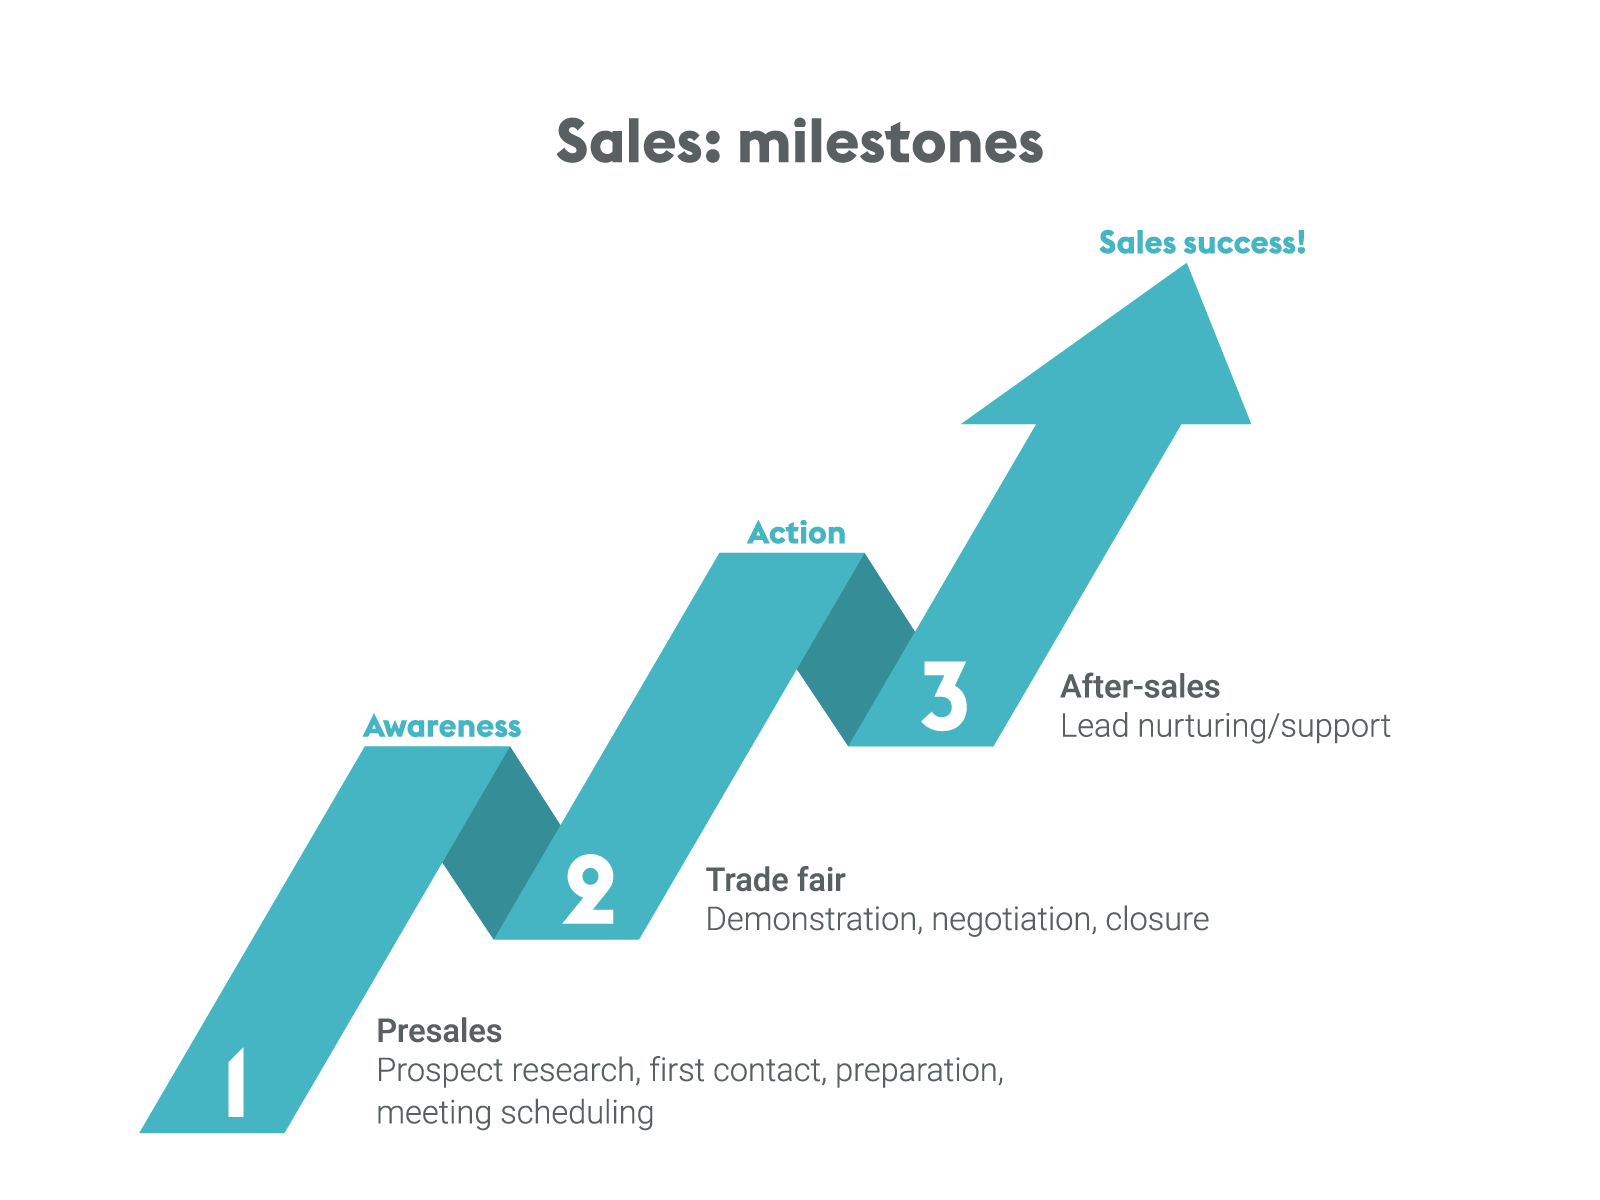
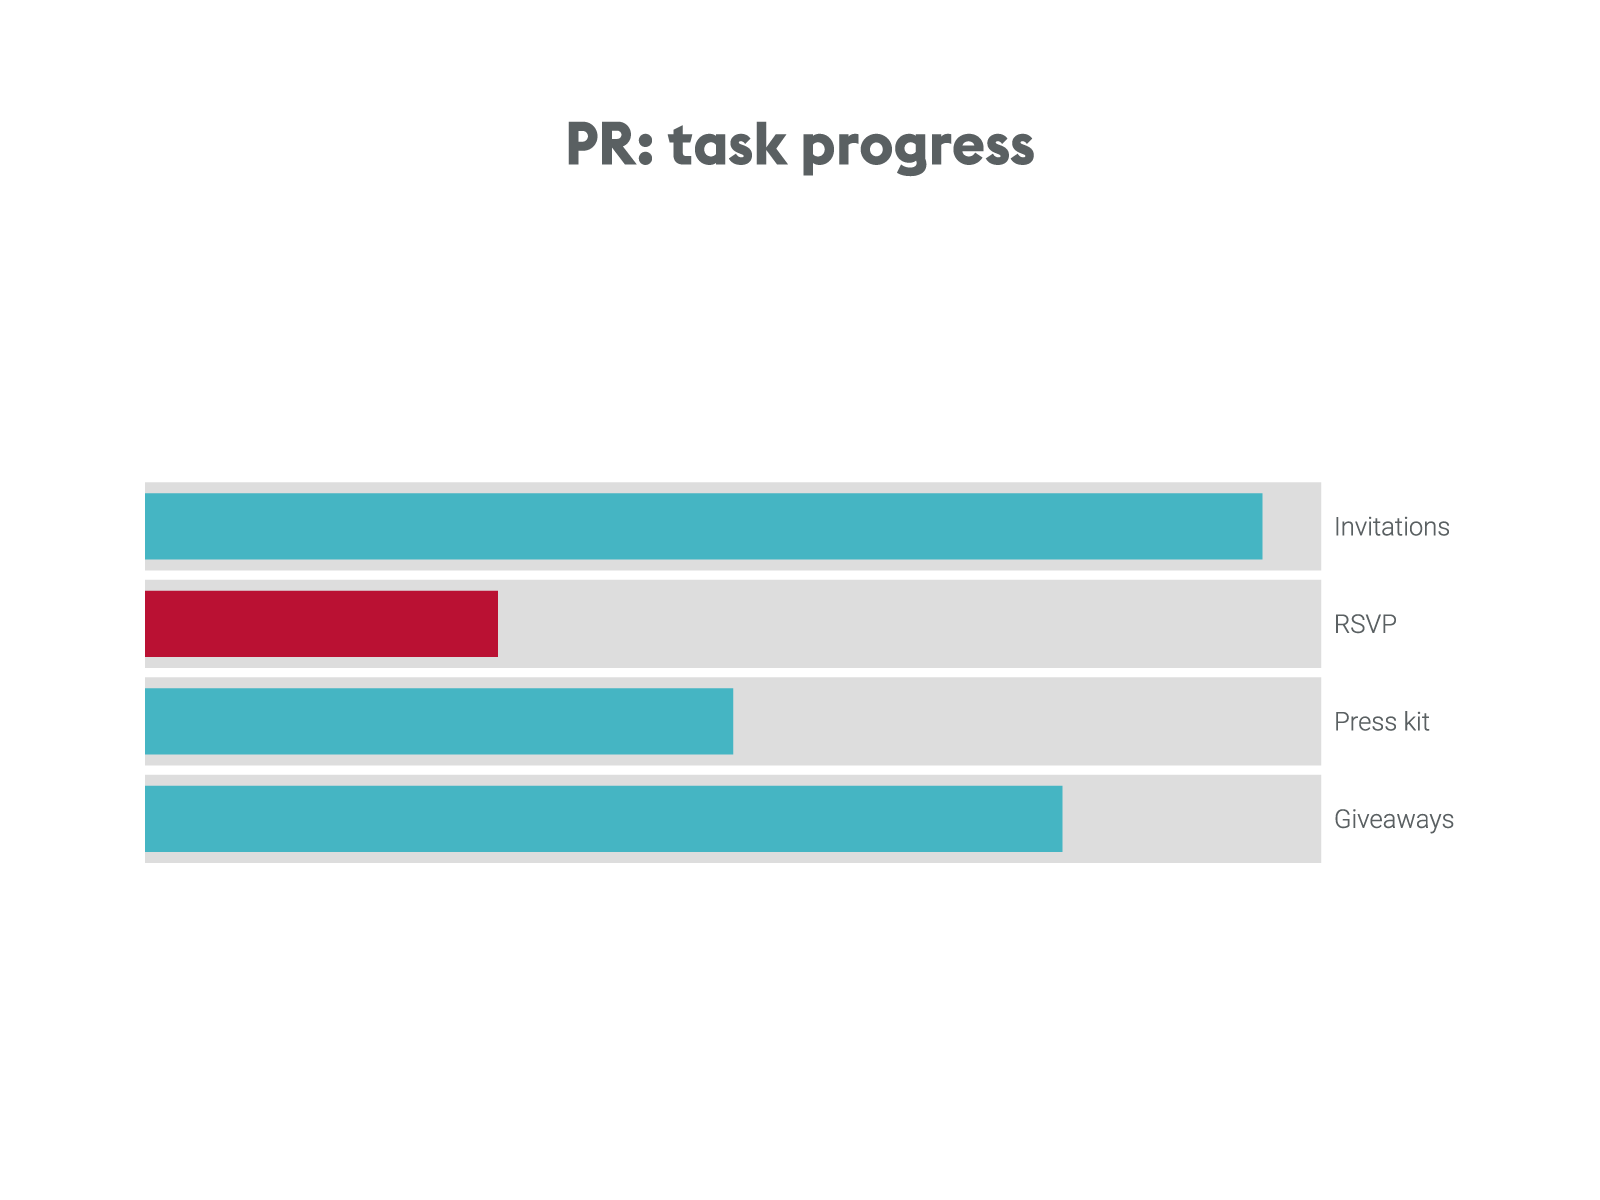
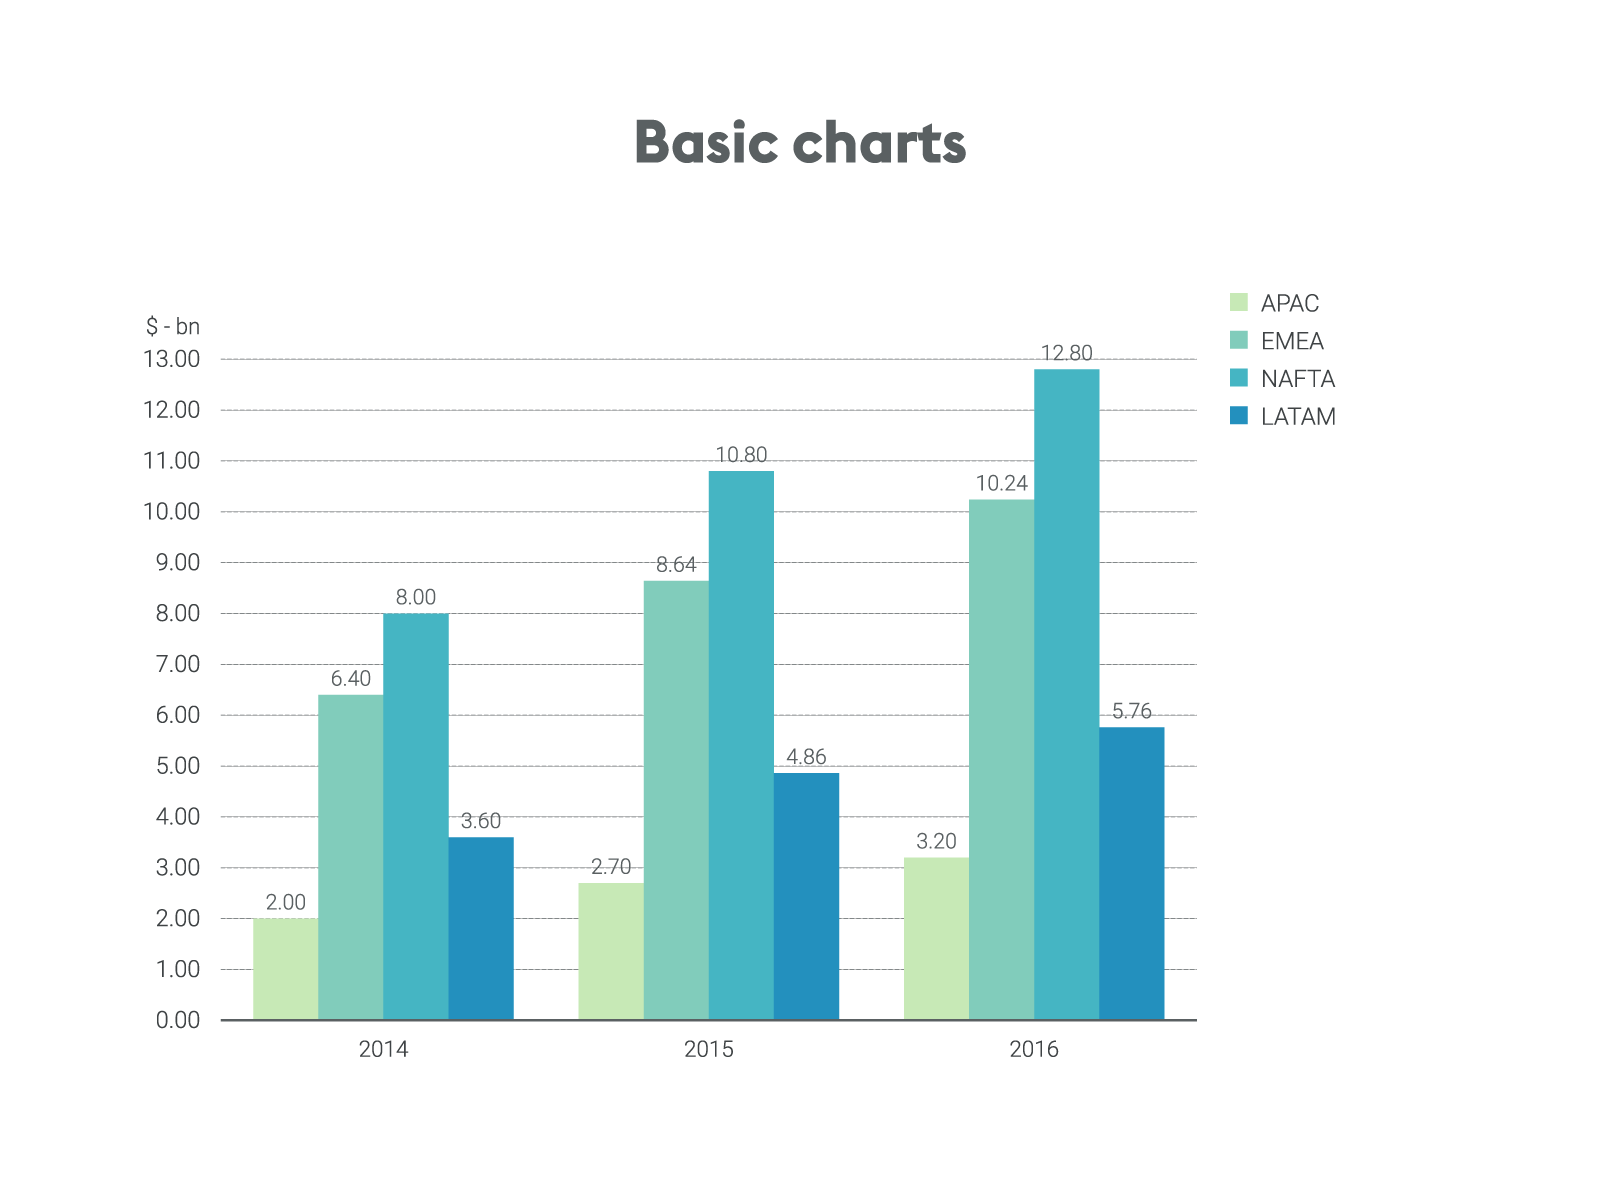
Some examples
Features
Easy to create and export
Paste your data from Excel and insert the charts into your documents by drag and drop.

Compliant to your
corporate design
Select colors, fonts and add your logo. Create corporate themes available for your co-workers.

Designer-grade quality
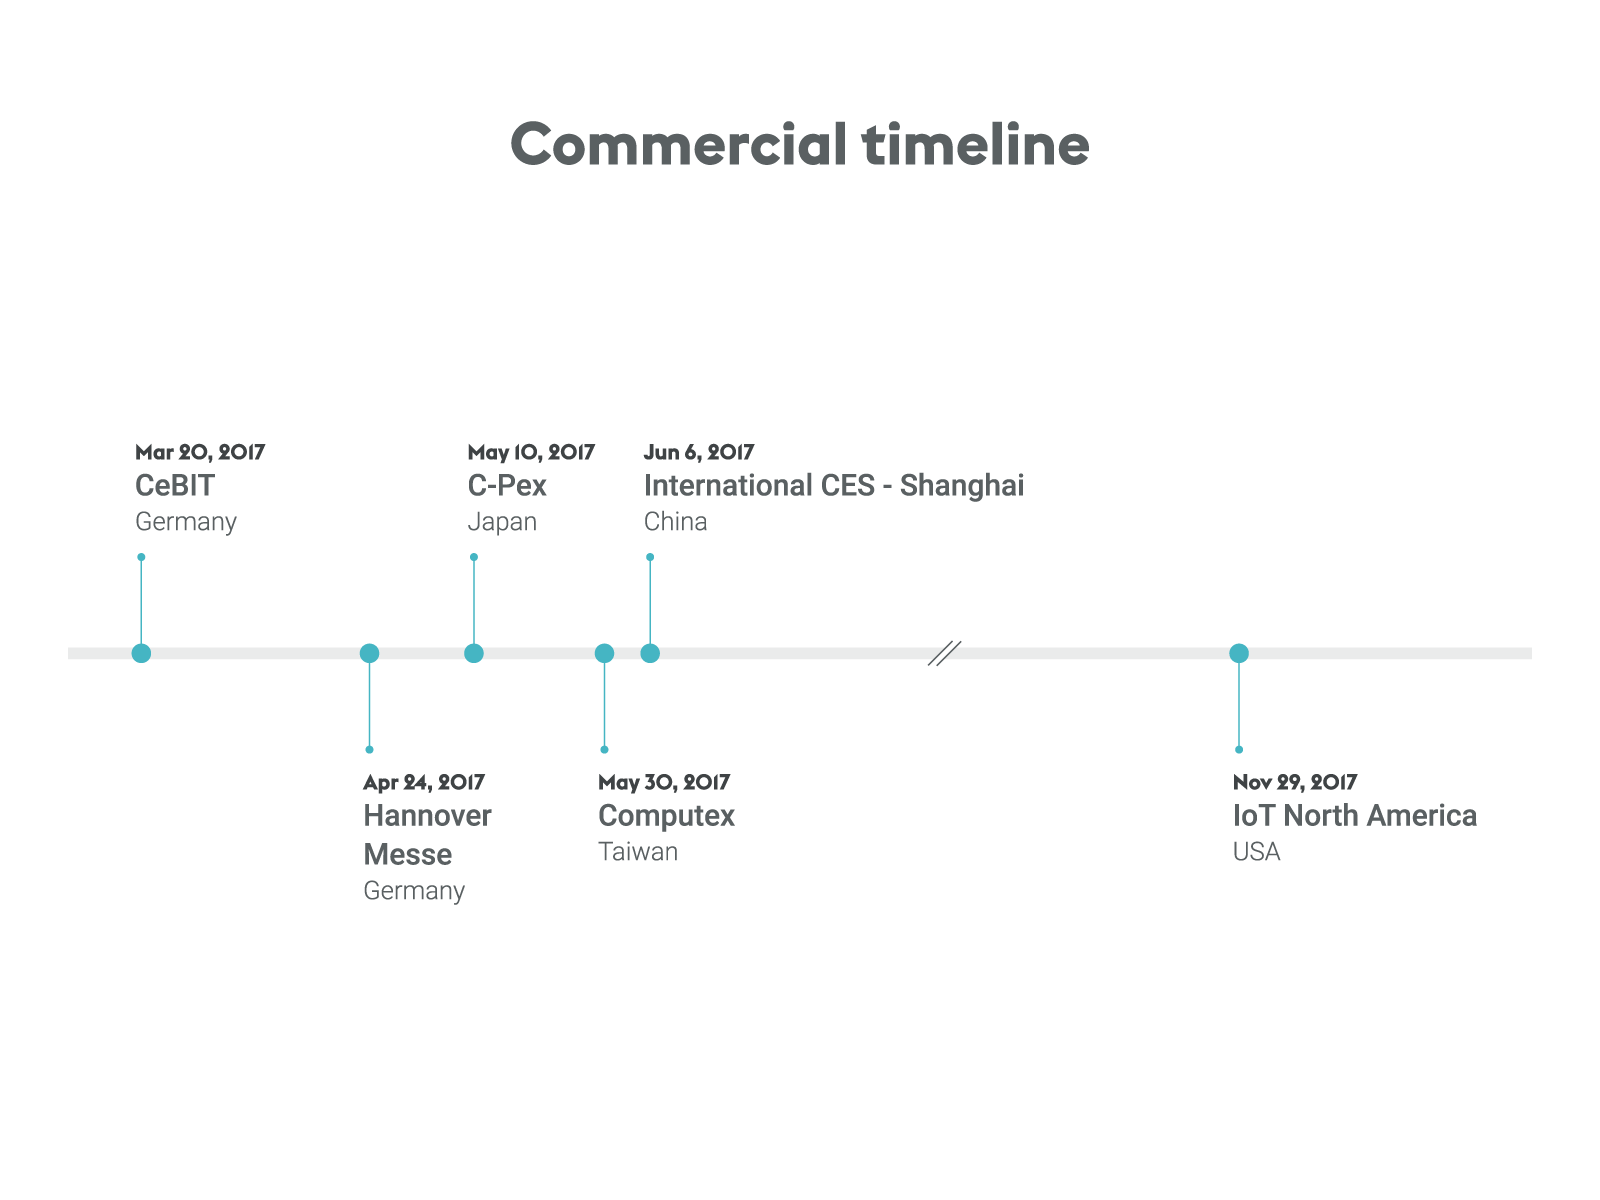
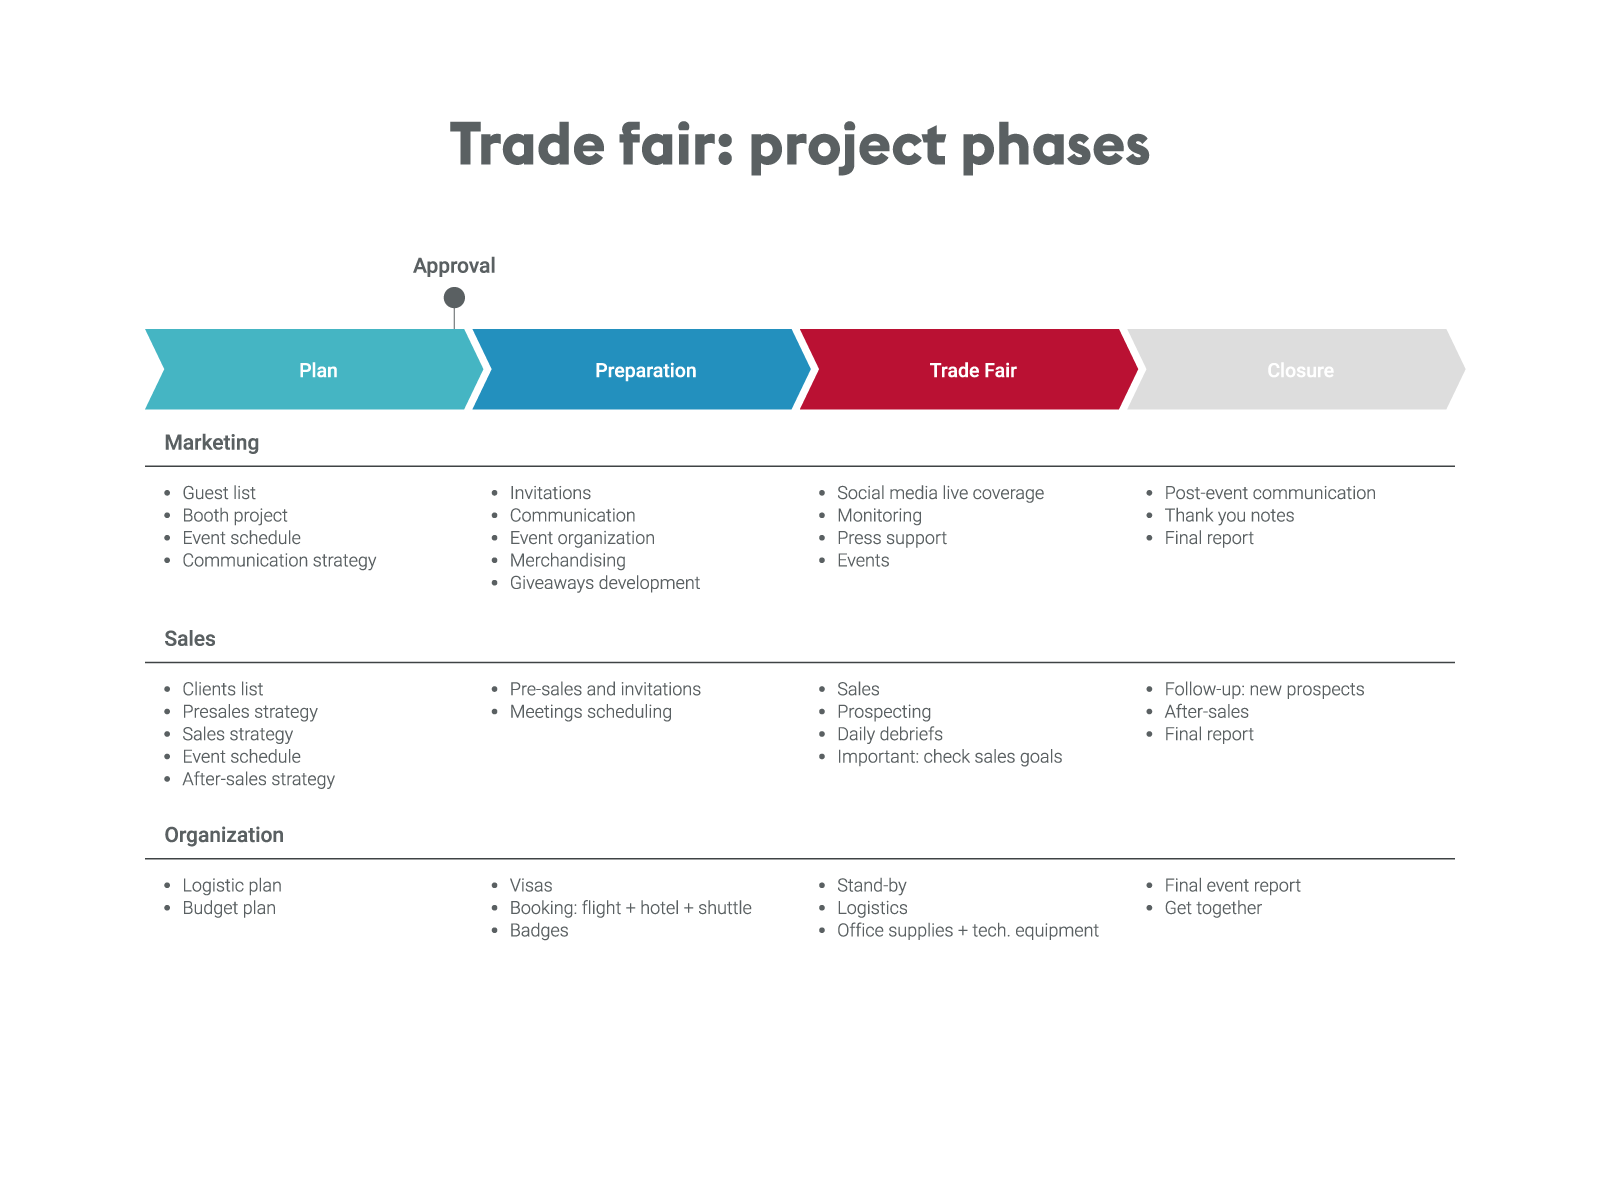
Professionally designed concept and data-driven charts, including Gantt diagrams, timelines, and milestones plans.
Loved by professionals around the world