


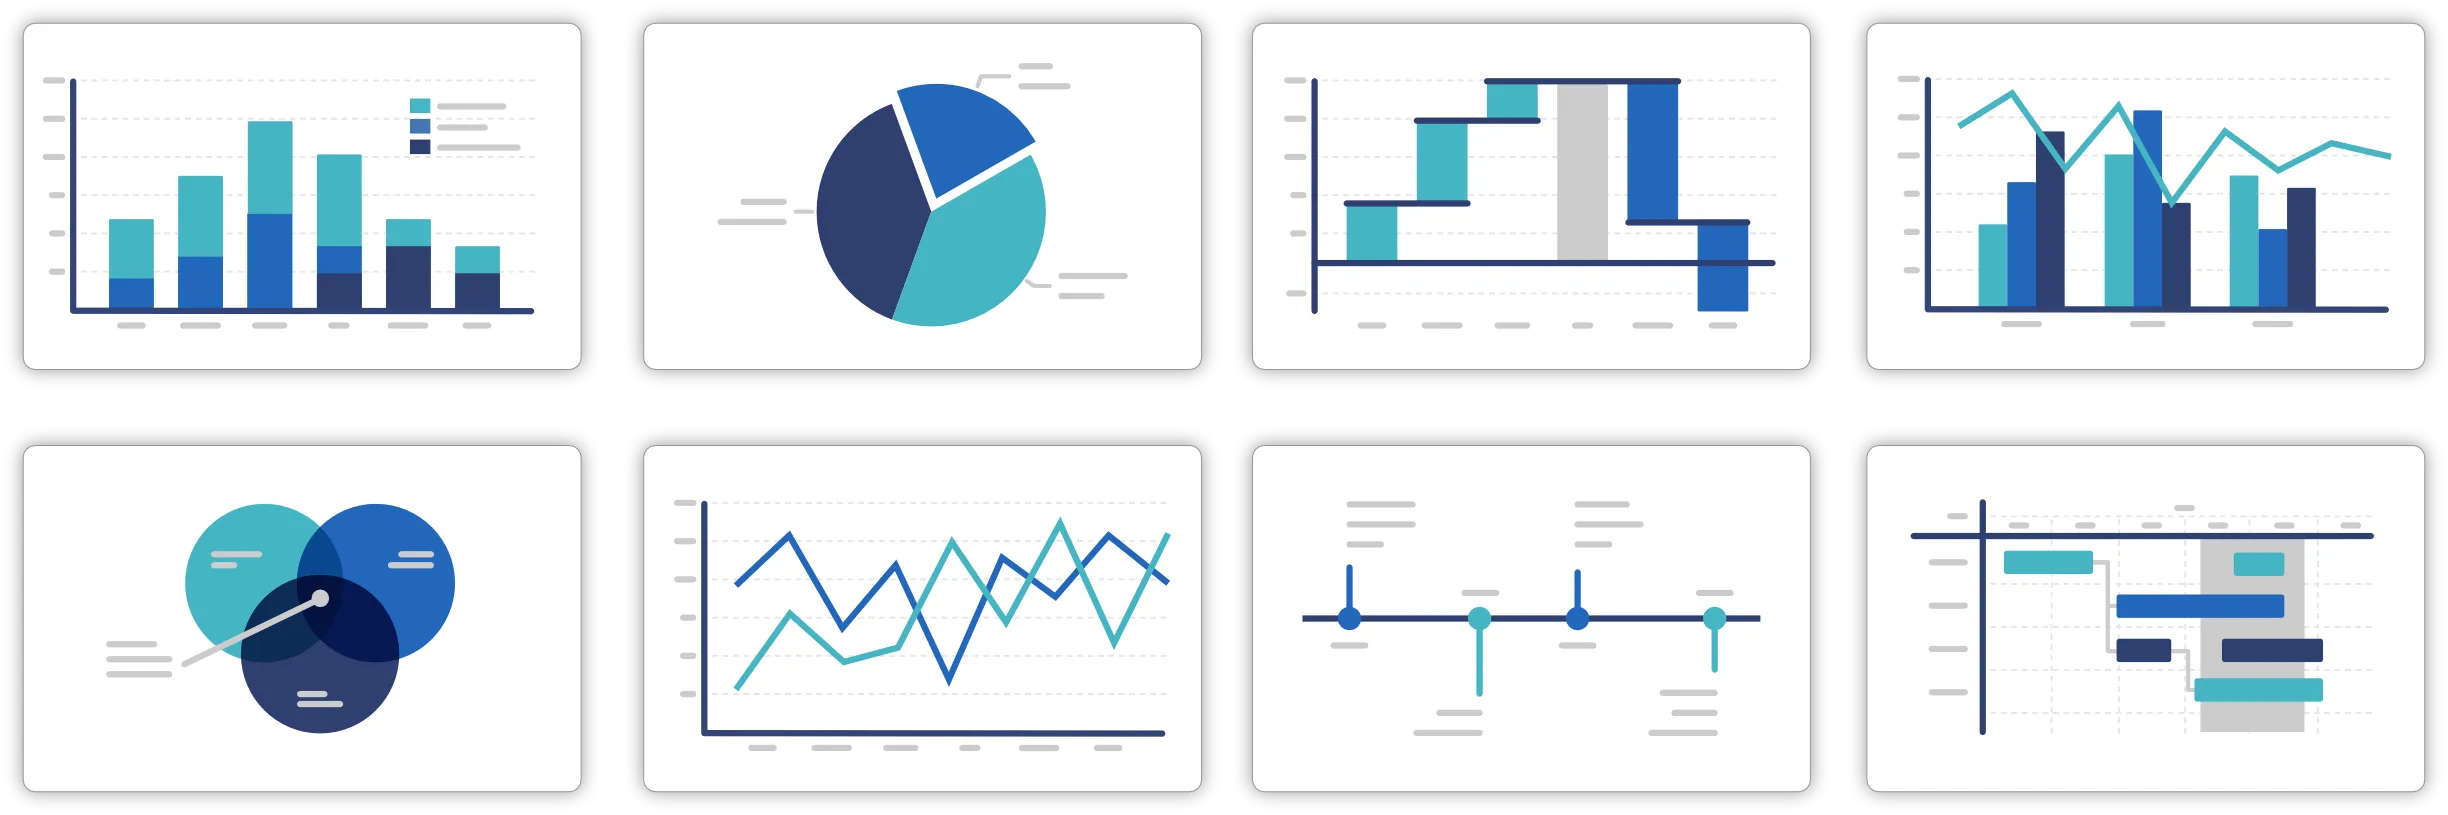
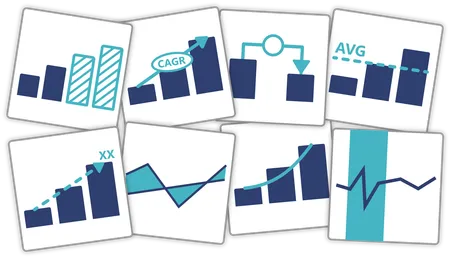
Charts for every presentation need
From project planning and roadmaps to performance tracking and reporting, choose from 120+ chart types designed to communicate complex information clearly and professionally.
Explore 120+ Chart Types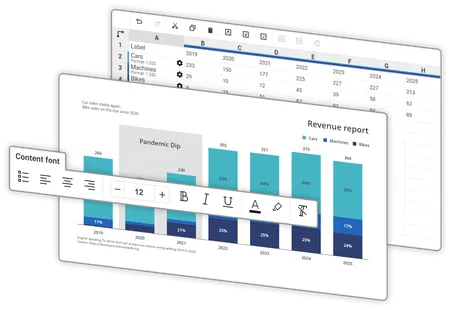
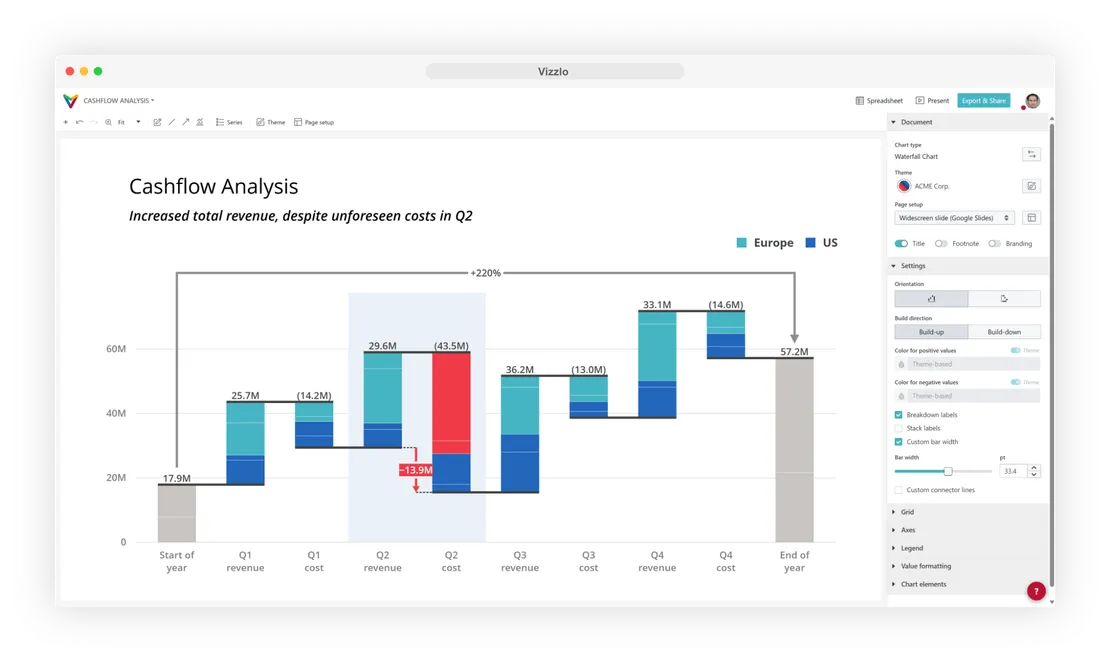
From data to chart in seconds
Paste your data, upload a file, or enter it directly. Vizzlo handles the structure and formatting so you can turn raw data into presentation-ready visuals and save hours on manual work.
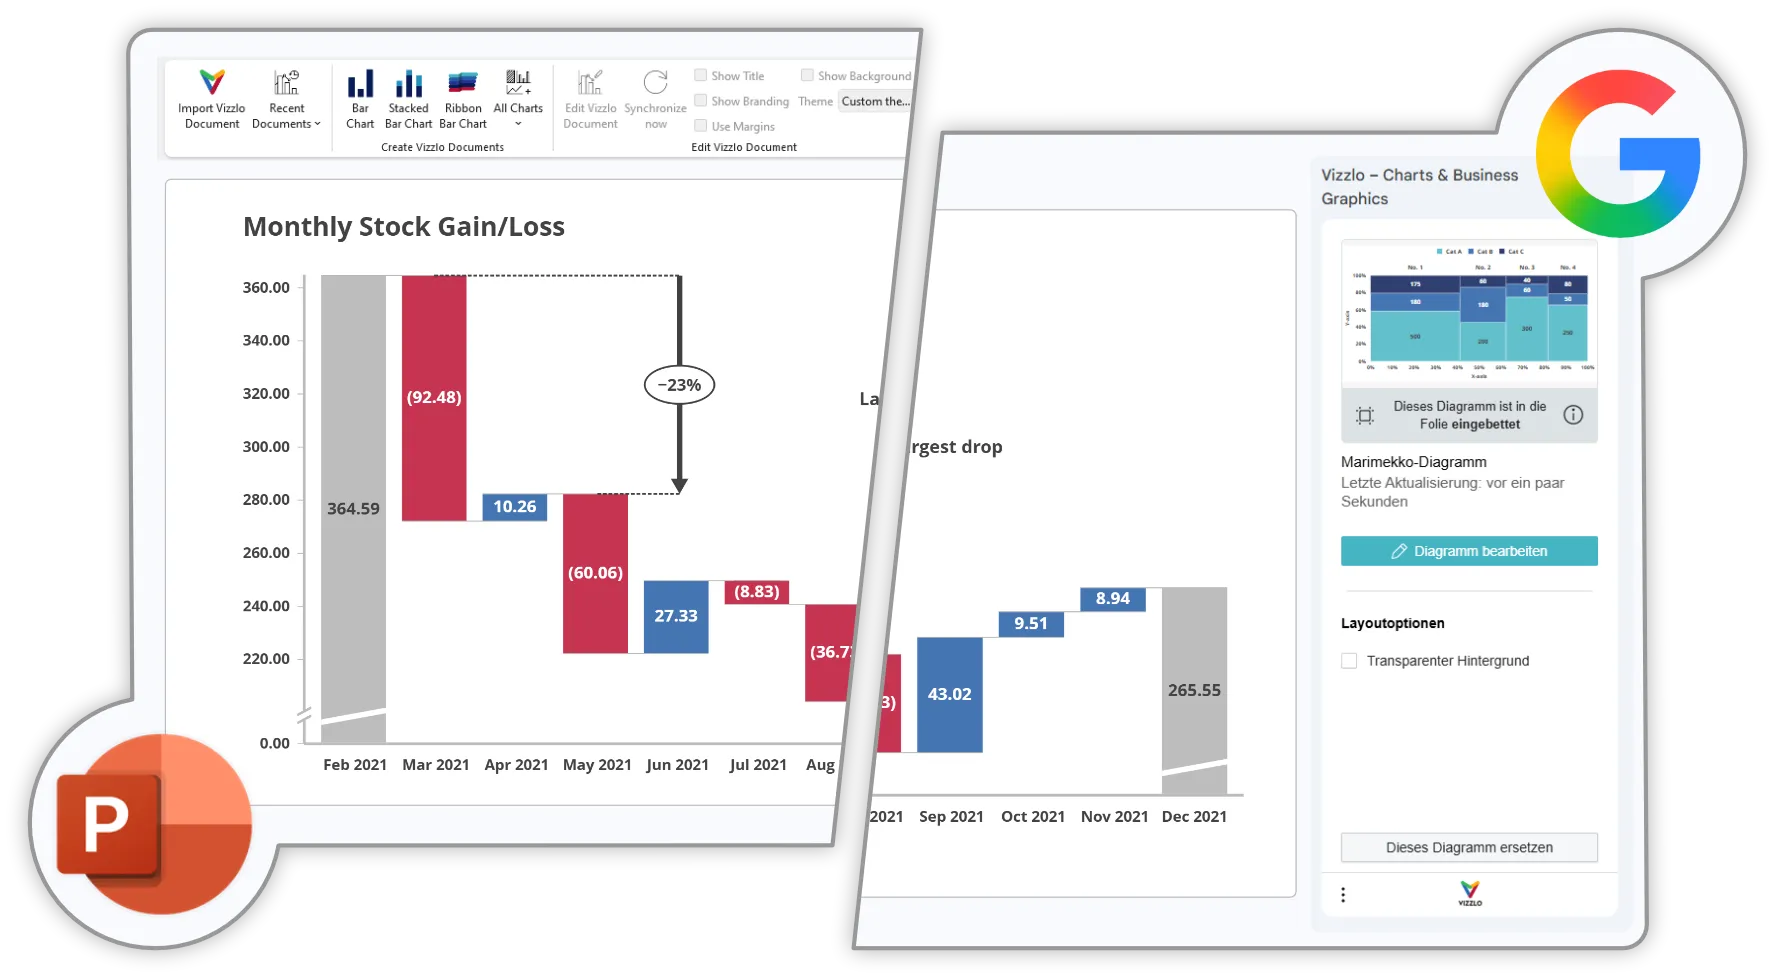
Works where your team works
Create and edit charts directly in Google Slides or PowerPoint, or use Vizzlo in your browser or desktop. No extra tools, no manual transfers—just a seamless workflow.
Choose your platform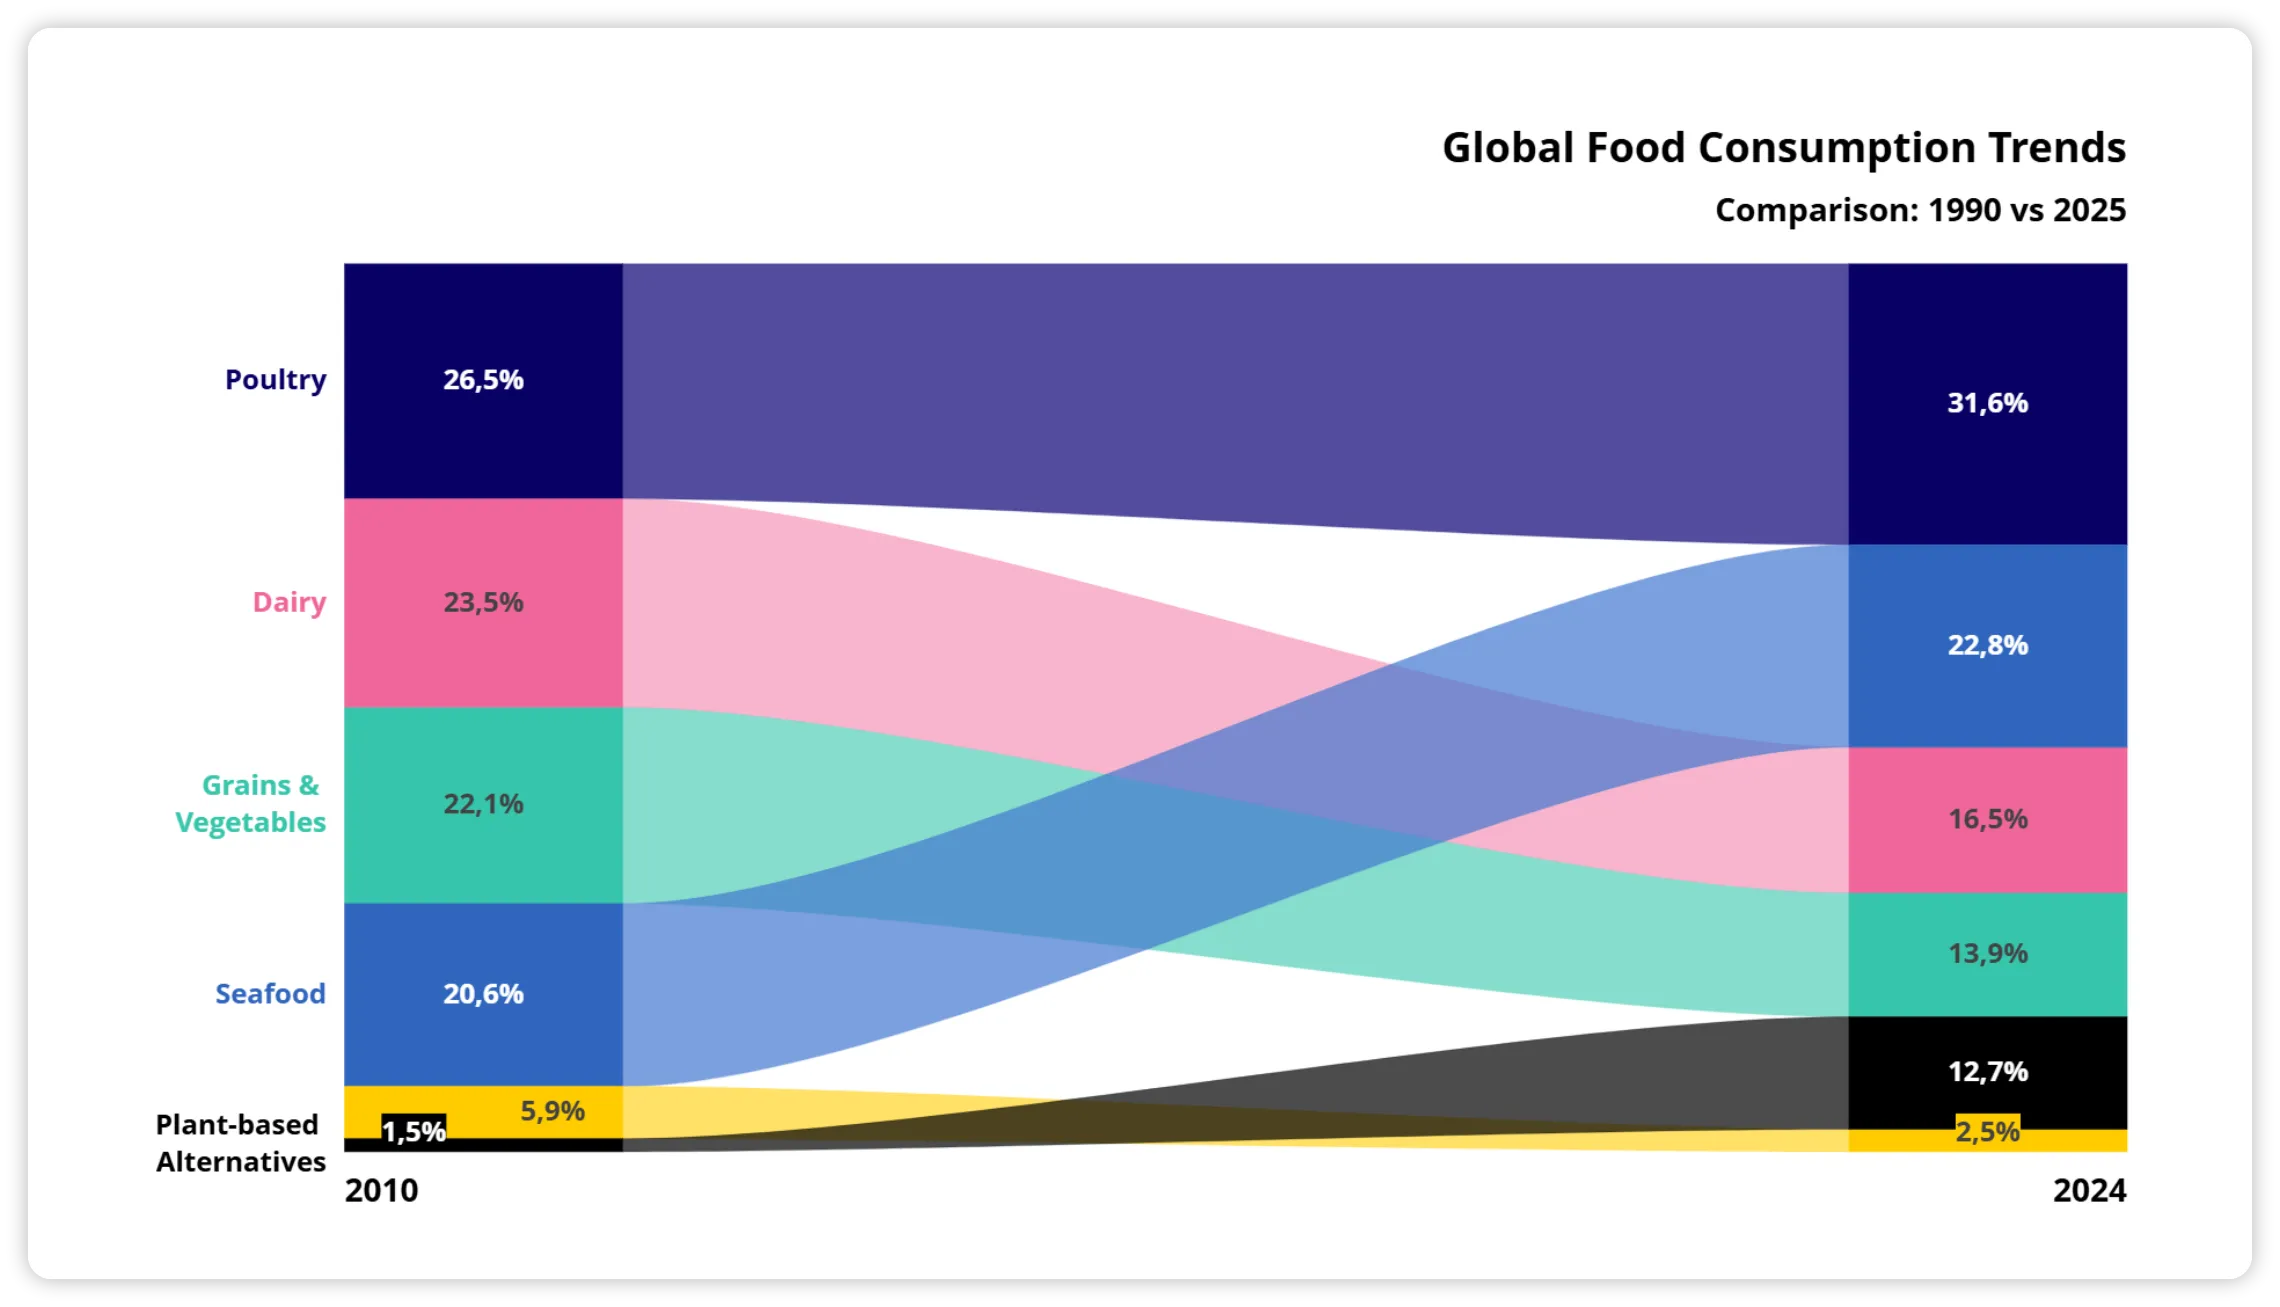
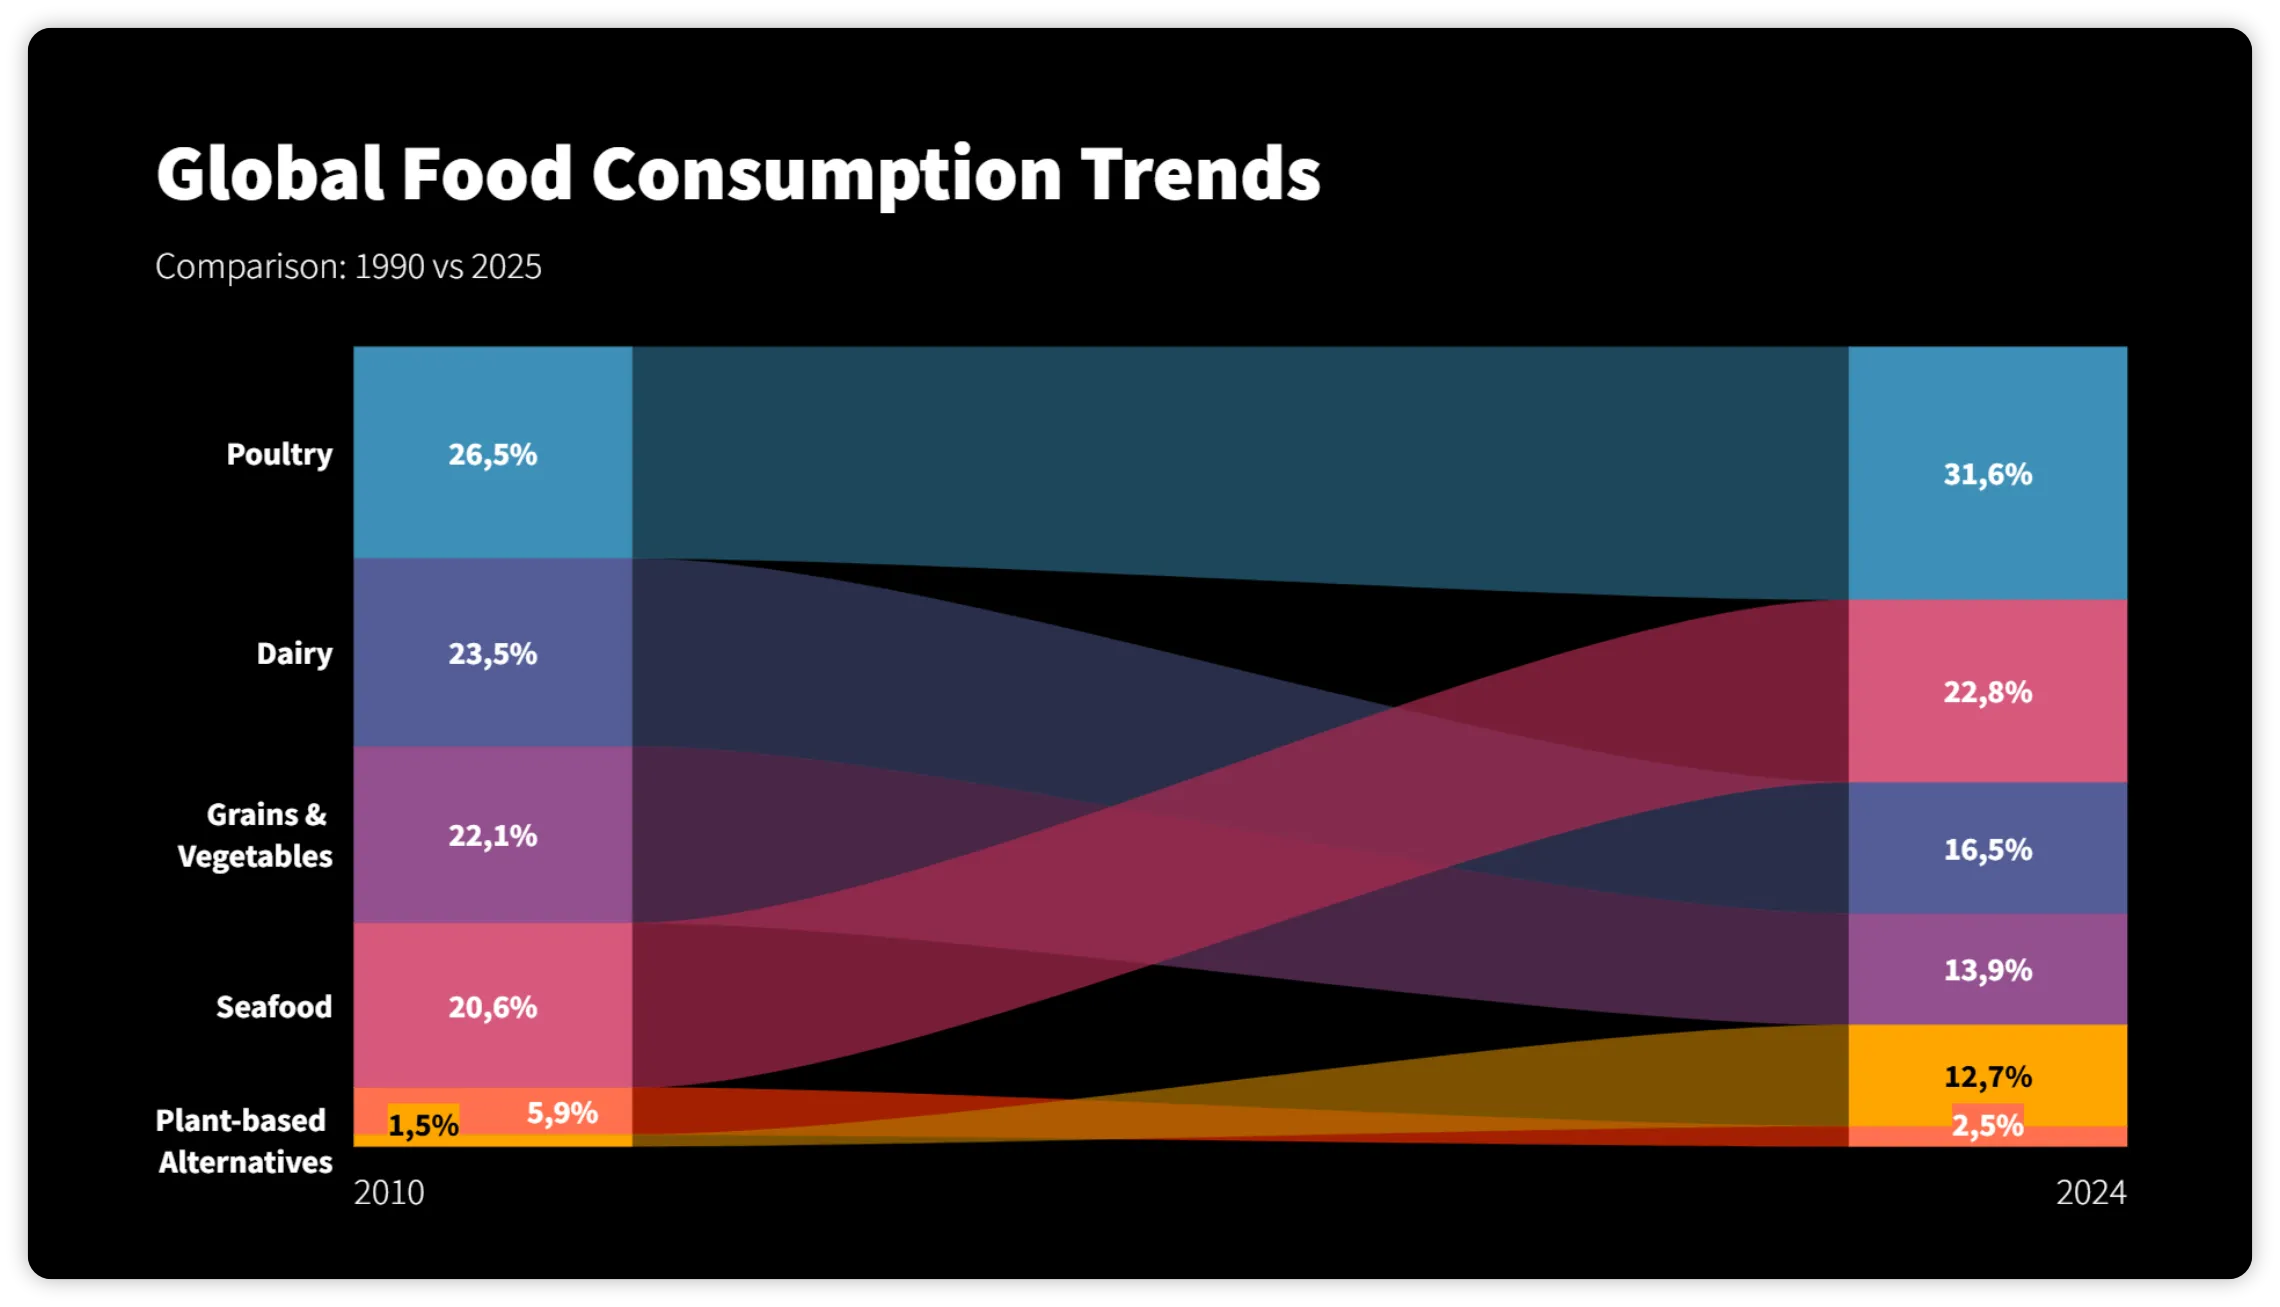
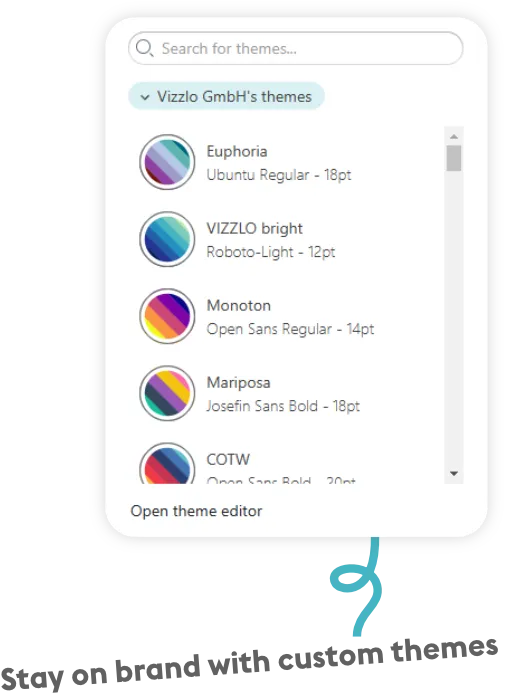
Keep every chart on brand
Apply shared colors, fonts, and templates to ensure every visual follows your company’s design standards—across teams, presentations and projects.
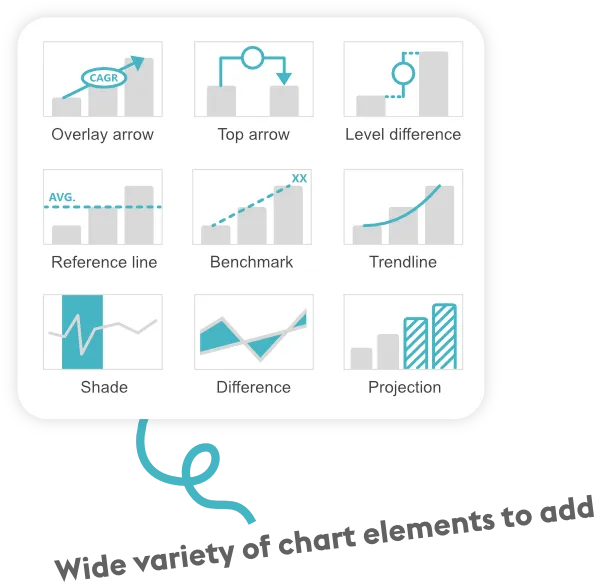
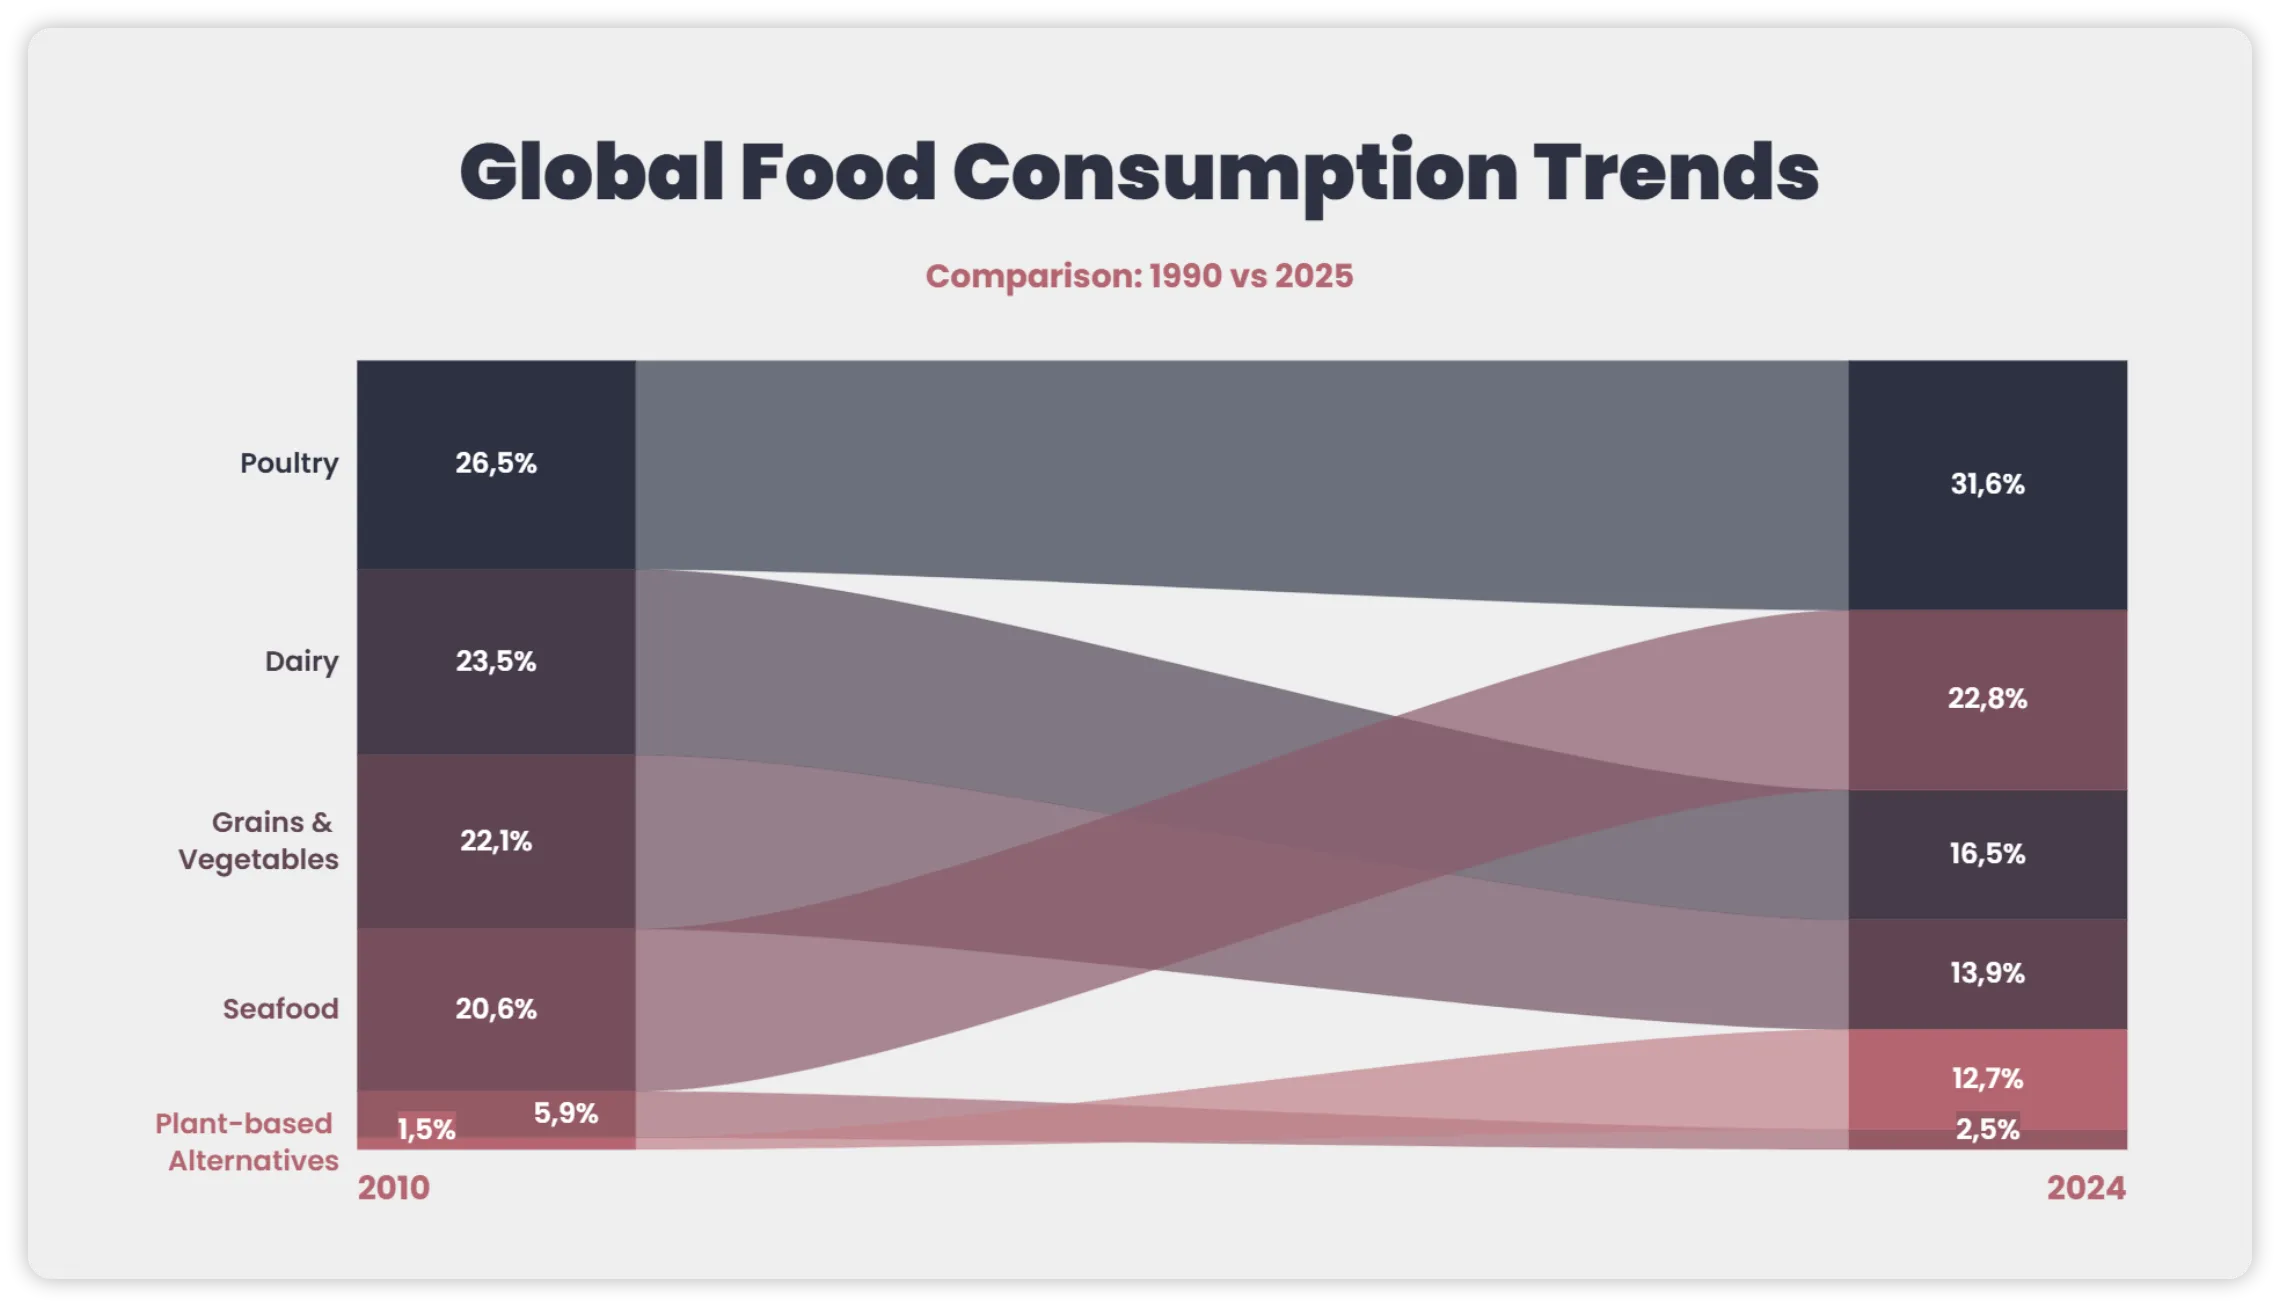
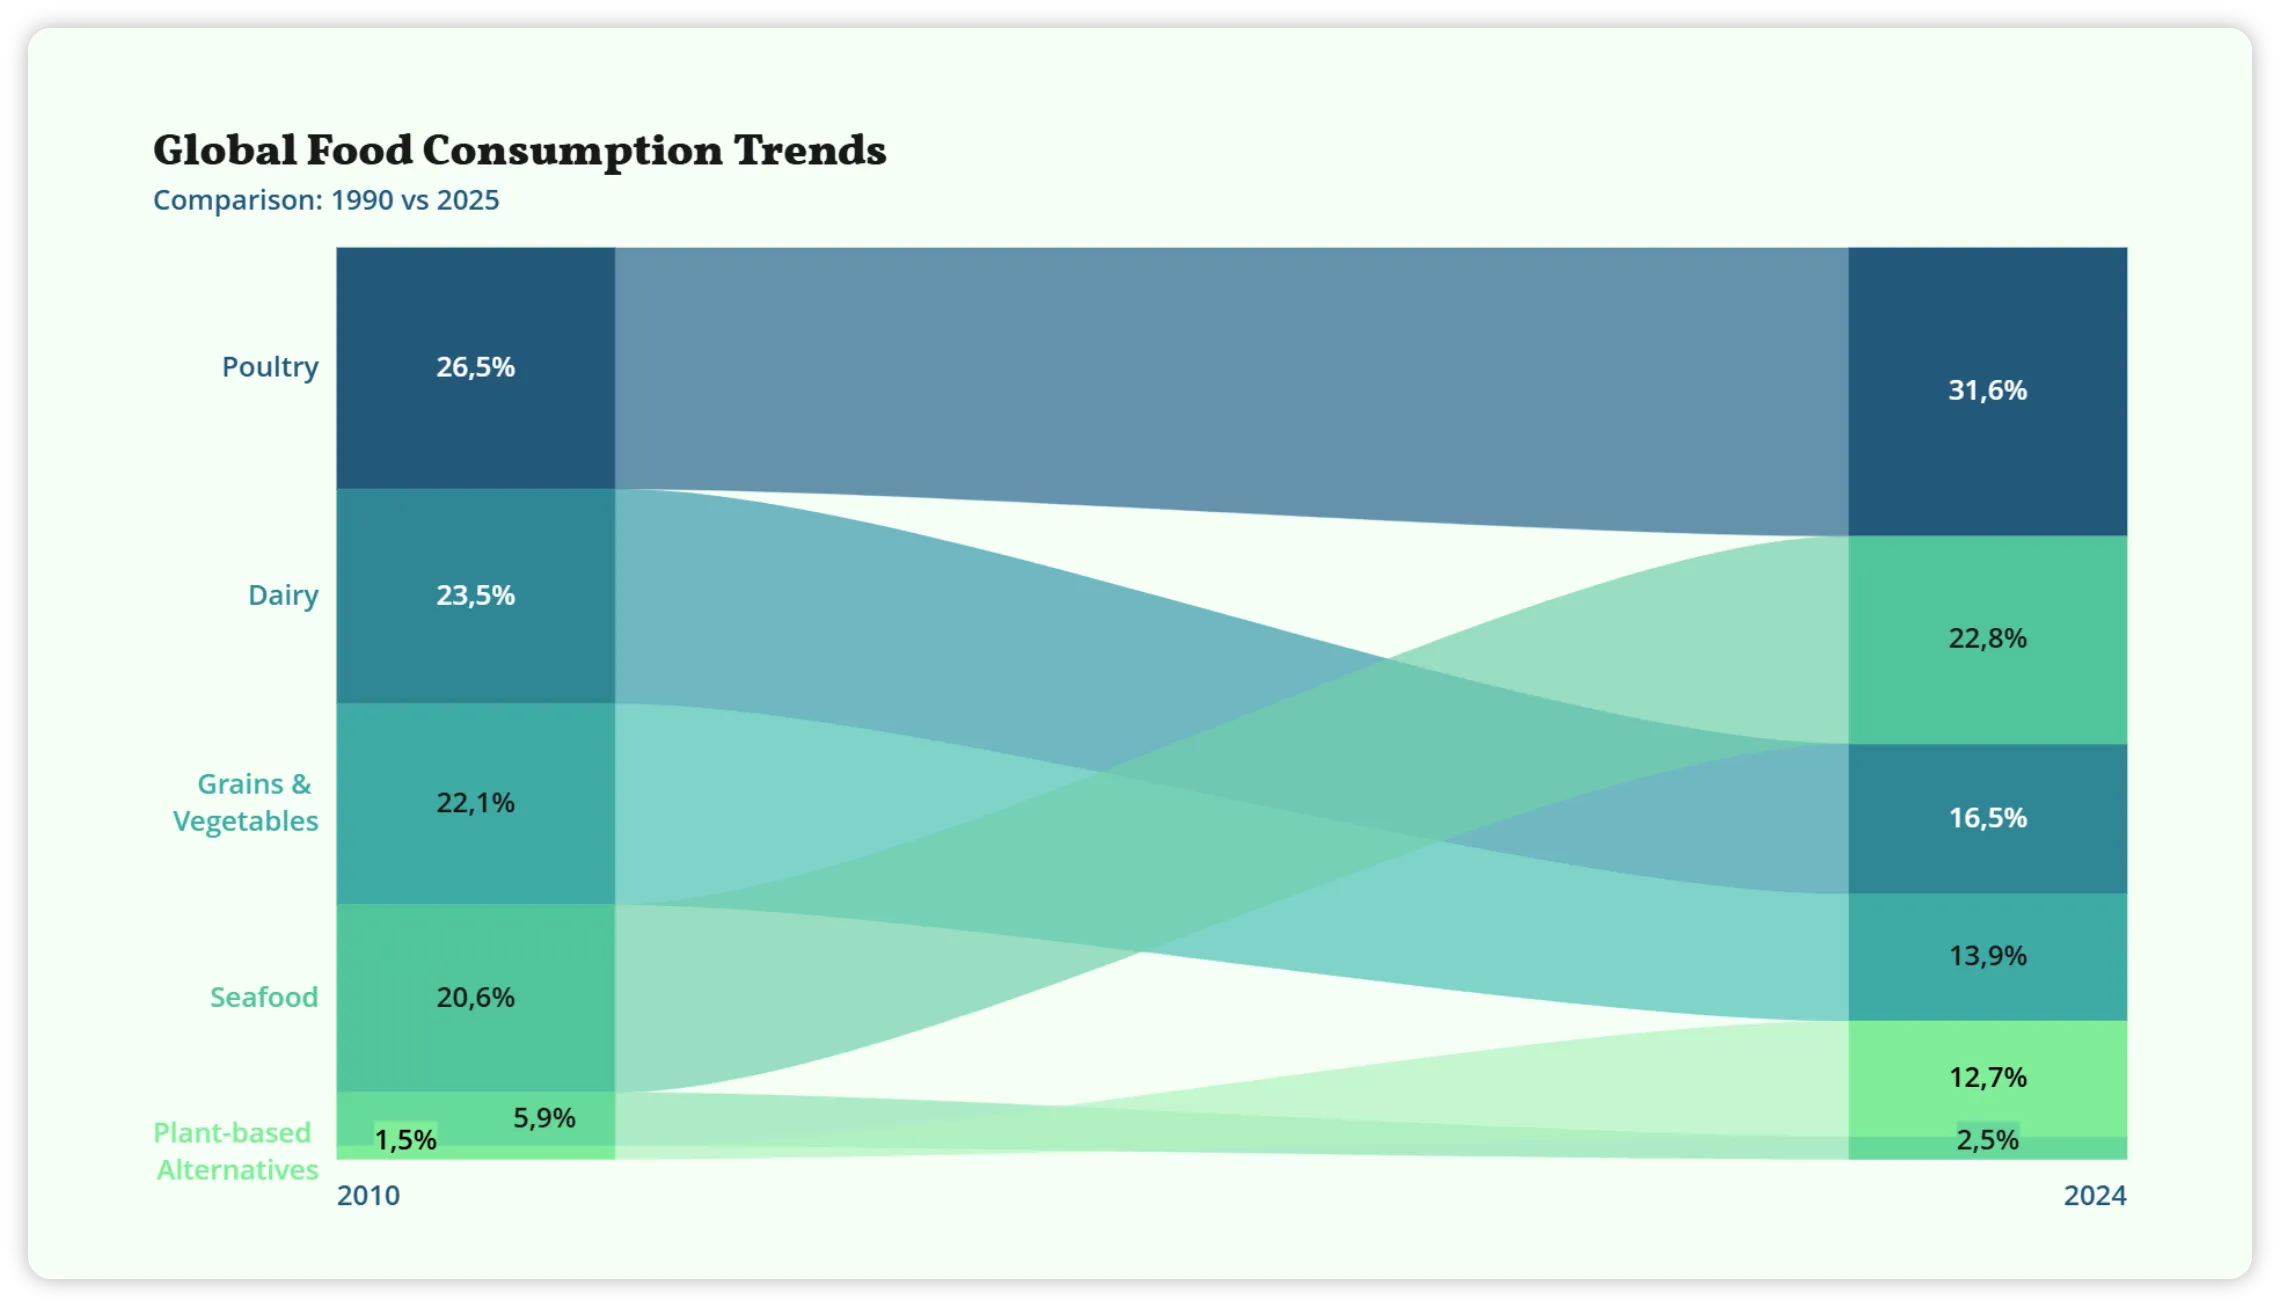
Highlight what matters
Go beyond basic charts with elements that bring attention to key insights. Add arrows to show growth, projections to illustrate trends, reference lines for context, or shaded areas to emphasize what matters most.

Always up to date
Connect charts to cloud files or public data sources and keep them updated automatically. Changes are reflected wherever your charts are used.
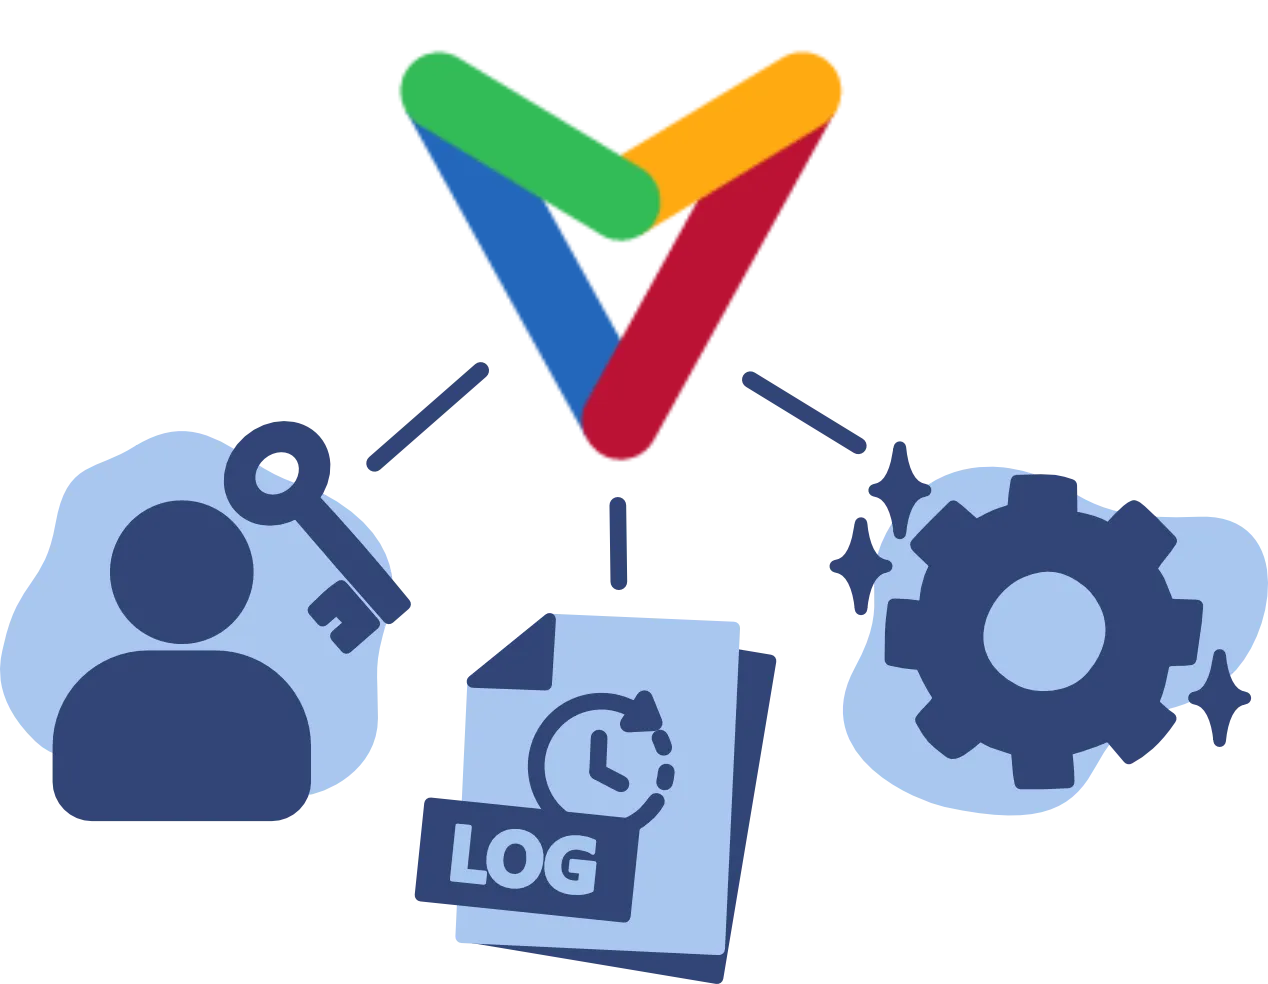
Built for enterprise
SSO, role-based access, centralized license management, and audit logs —everything you need for secure team deployment.
Enterprise details
Create charts with AI
Describe your data or goal and let Chart Vizzard generate a fully editable chart in seconds— ready to refine and customize.
Create with AI