Chart Vizzard
Vizzlo's AI-based chart generatorCreate your Trade-Off Diagram in seconds
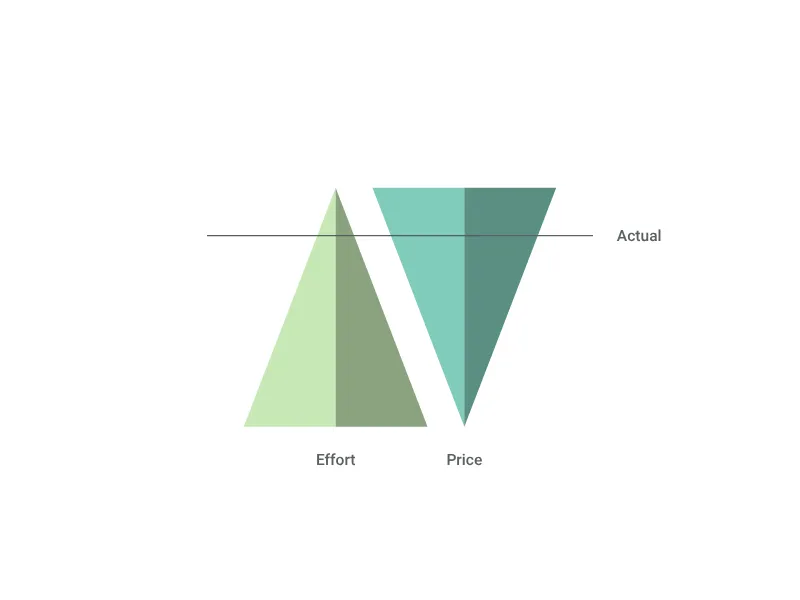
Visualize the trade-off between two different aspects of the same thing.
Create your chart in 3 simple steps
- Create new Trade-Off Diagram
- Add your data
- Export or share
Why Vizzlo?
- Create professional charts in seconds
- Fully customizable, no design skills needed
- Create directly in PowerPoint & Google Slides
What is a trade-off diagram?
The Trade-Off Diagram visualizes the fundamental business concept that achieving one objective often requires sacrificing another. This powerful analytical tool uses a balance scale metaphor with descriptive arrows to illustrate competing forces, helping audiences understand complex decisions where gains in one area mean losses in another.
Key Features
- Balance visualization: Clear representation of competing priorities or objectives
- Directional arrows: Labeled arrows show the opposing forces or trade-off dimensions
- Current state indicator: Adjustable position marker showing present balance point
- Ratio control: Precise slider to position current state along the trade-off spectrum
- Optional legend: Toggle legend display for additional context
- Flexible labeling: Custom descriptions for both sides of the trade-off
- Reference categories: Optional list of related items or considerations
Best Use Cases
- Strategic decision analysis: Balancing cost versus quality, speed versus accuracy
- Resource allocation: Choosing between competing priorities or investment options
- Product development: Weighing features versus simplicity, performance versus cost
- Project management: Balancing scope versus timeline, quality versus budget
- Business model analysis: Revenue growth versus profitability, market share versus margins
- Risk management: Security versus usability, safety versus efficiency
- Organizational design: Centralization versus autonomy, standardization versus flexibility
Configuration Options
Customize your trade-off analysis with comprehensive controls:
- Trade-off dimensions: Custom labels for the opposing forces or priorities
- Current position: Ratio slider (0-100%) to show where you currently stand
- Scale label: Custom descriptor for the current state position
- Legend display: Toggle legend visibility for additional context
Trade-Off Analysis Framework
Effective trade-off visualization helps with:
- Decision clarity: Visual representation of what must be sacrificed
- Stakeholder alignment: Shared understanding of competing priorities
- Strategic positioning: Where the organization chooses to compete
- Performance evaluation: Assessment of current balance versus optimal position
Visual Communication Advantages
The trade-off format provides immediate understanding:
- Intuitive balance: Everyone understands the see-saw concept
- Position clarity: Current state is immediately visible
- Decision framework: Clear structure for evaluating alternatives
- Change implications: Easy to see what moving the balance would mean
Strategic Applications
This visualization excels for:
- Executive decision support: Visual framework for complex strategic choices
- Investment decisions: Balancing competing uses of limited resources
- Product positioning: Finding optimal balance between competing attributes
- Organizational alignment: Helping teams understand strategic trade-offs
Professional Context
Trade-off analysis is fundamental to business strategy because:
- Resource constraints: Organizations cannot optimize everything simultaneously
- Market positioning: Success requires choosing where to excel versus where to accept limitations
- Stakeholder management: Different groups often prefer different sides of trade-offs
- Competitive advantage: Strategic trade-offs can create sustainable differentiation
The Trade-Off Diagram transforms abstract strategic concepts into concrete visual frameworks that facilitate better decision-making and clearer communication about the inevitable choices organizations must make.
Trade-Off Diagram: What's new?
Trade-Off Diagram Alternatives
Use Cases
Gauges & Status chartsEnhance your productivity
Create a Trade-Off Diagram directly in the tools you love

Create a Trade-Off Diagram in PowerPoint with
Vizzlo's add-in

Loved by professionals around the world


Visualizations your audience won’t forget
Convey abstract concepts and data with professionally designed
charts and graphics you can easily edit and customize.