Chart Vizzard
Vizzlo's AI-based chart generatorHow to Create a Venn Diagram in Google Slides
Vizzlo is an online tool that helps you to create beautiful charts and business graphics easily. Besides our web app at vizzlo.com, Vizzlo offers a PowerPoint add-in that ships with our free desktop app for Windows and a Google Slides add-on. With more than 100 chart templates, unlimited features, and seamless integration, Vizzlo helps you create visualizations with ease.
In this tutorial we will show you how to create and customize a Venn diagram using Vizzlo from Google Sheets. All you need is to create a Vizzlo account.
Start creating your own charts and business graphics.
Try Vizzlo for freeGetting started with Vizzlo for Google Slides
Install the add-on from the Google Workspace Marketplace. In an open Google Slides presentation you can also click on Add-ons —> Get add-ons and search for ‘Vizzlo’.
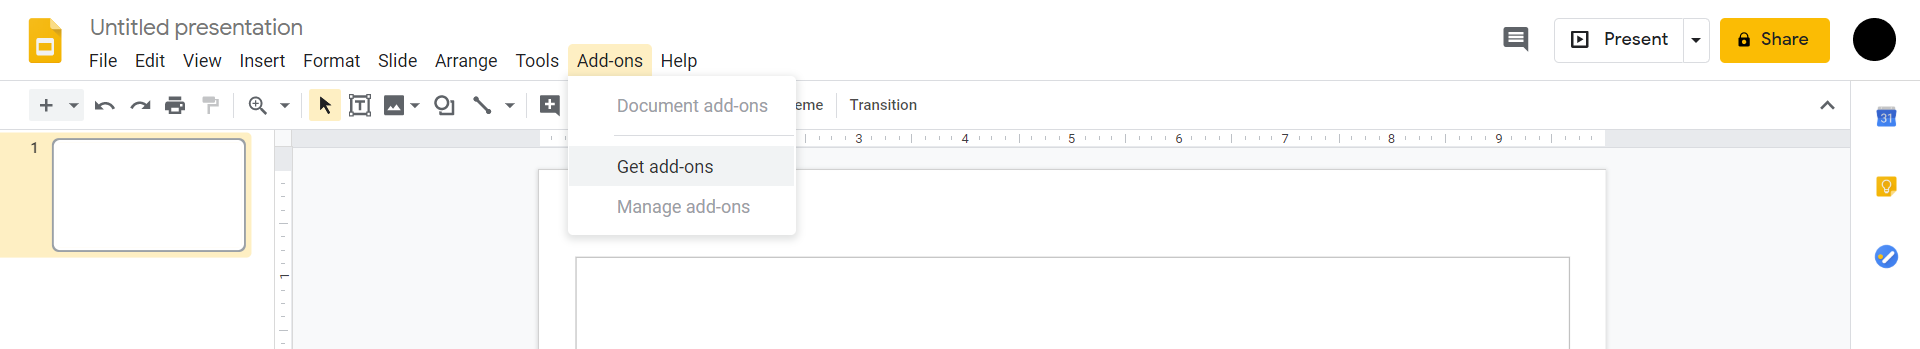
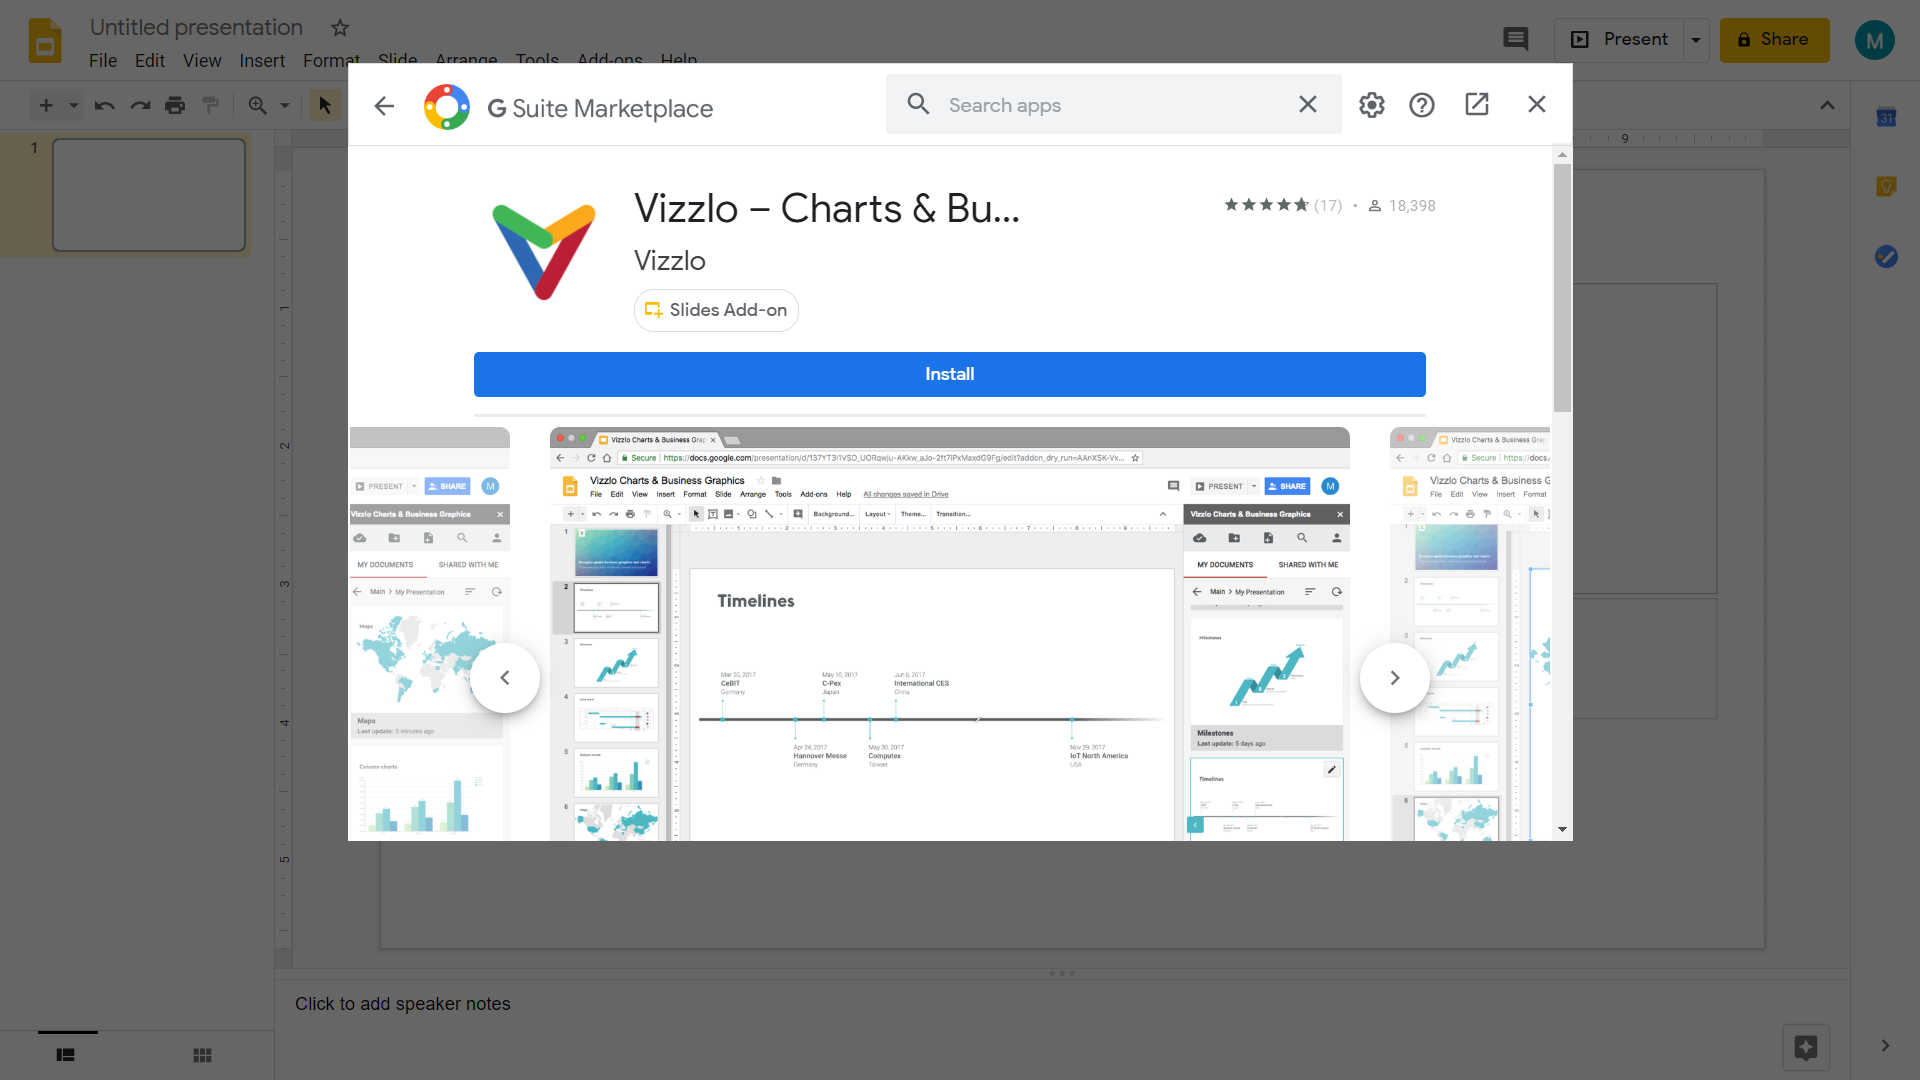
A dialog will open and all you need to do is click on Install.
Known issue
Once you have installed the add-on, there is not much you can do with it except contacting our help center. You need to refresh the page first. We have reported this bug to Google. Once you connected the add-on with your Vizzlo account, you will be able to use all its features according to your subscription plan.
If you used Vizzlo on our website before you’ll find all your documents in the sidebar.
How to Create a Venn Diagram in Google Slides?
- Open a Google Slides document.
- Add-ons > Vizzlo — Charts and Business Graphics > Insert.
- Click on the New document icon and you will be navigated to Vizzlo’s portfolio.
- Type “Venn” > hit
Enter - Click Create new and start customizing your Venn diagram
What is a Venn diagram?
Before we start, let find out what a Venn diagram actually is and how it can help you. A Venn diagram shows all possible logical relations between a finite collection of different sets. These diagrams consist of several overlapping circles, each representing a set. A Venn diagram is a great way to visualize the structure of set relationships in a metaphorical way rather than a mathematically accurate way.
Create a Venn Diagram from a template
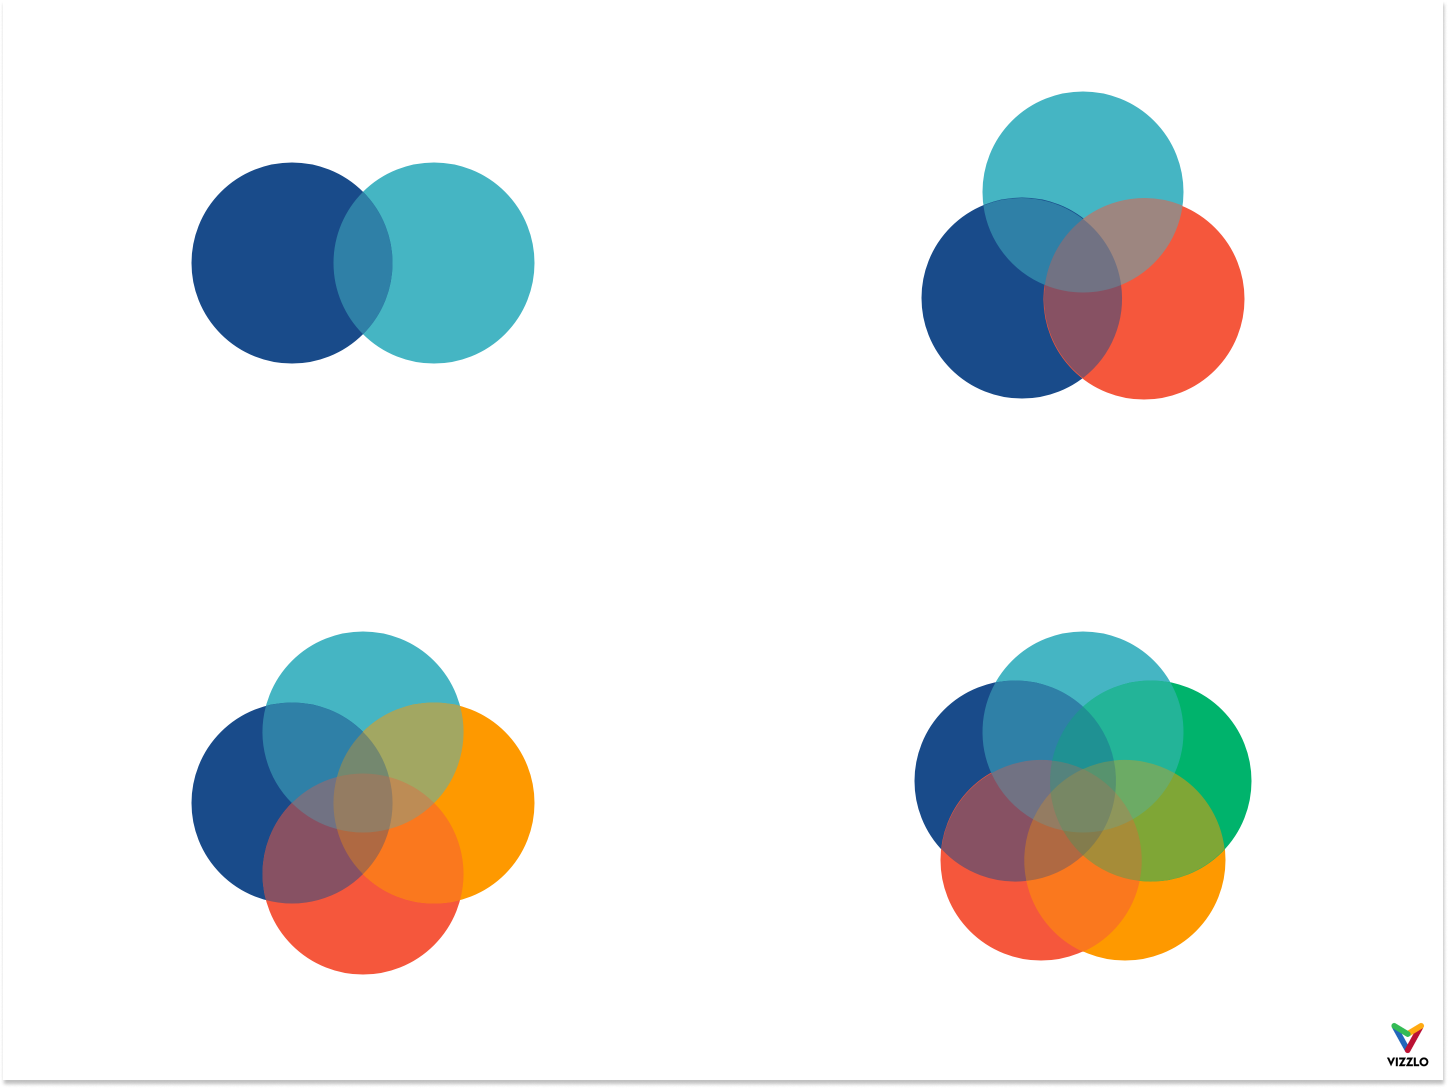
When you create a Venn diagram with Vizzlo you will have the option to choose from pre-made Venn diagram templates. By default, a Venn diagram will consist of three circles. Need more? Need less? Depending on the complexity and interaction of your data, you can choose from four different templates.
All the options to customize your Venn diagram can be found in the sidebar. To change the template, click on any of the buttons shown under Templates.
Below this button group you’ll find sliders to control:
— the width of the circles border
— the opacity of the fill color of the circles
— the distance of all circles to each other
— the angle by which the circles rotate around their center
Add new circles
The templates should help you to arrange your diagram easily. If you want to show more circles, click on the + button in the top right corner of the chart. You will notice a dashed and empty circle which shows the position where the new circle would be added.
What you will notice is that the selected option under Templates will change to the last option. This indicates a ‘custom layout’. When this option is selected, you cannot slide cycles in and out, nor rotate them.
If the total number of circles lies between two and five, you can always use the Templates setting to arrange your circles.
More circles can be added also when you click on + Add circle in the top bar.
Add an annotation
When you hover on any intersection you will notice that this intersection is highlighted by a white frame. To annotate that intersection click on it, a line and text annotation will be added to your plot.
In the sidebar a card will show the content and properties of your annotation. You can either change the content there or directly in the annotation. Besides, you can use the rich-text editor to customize the text. Highlight it and start editing.
Use the setting Show greatest possible intersection to highlight, well, the greatest possible intersection of a selected intersection.
Adjust properties of a single circle
For a single circle it is possible to
— change its size
— change its color, and
— center the text label.
Click on any circle and use the settings in the sidebar. Note that when you change the size of the circles, you no longer use a predefined template. Rotating and sliding in and out are disabled now.