Chart Vizzard
Vizzlo's AI-based chart generatorChanging Worlds: Germany's population in 1950 vs 2050

Part III of our Changing Worlds population pyramid series.
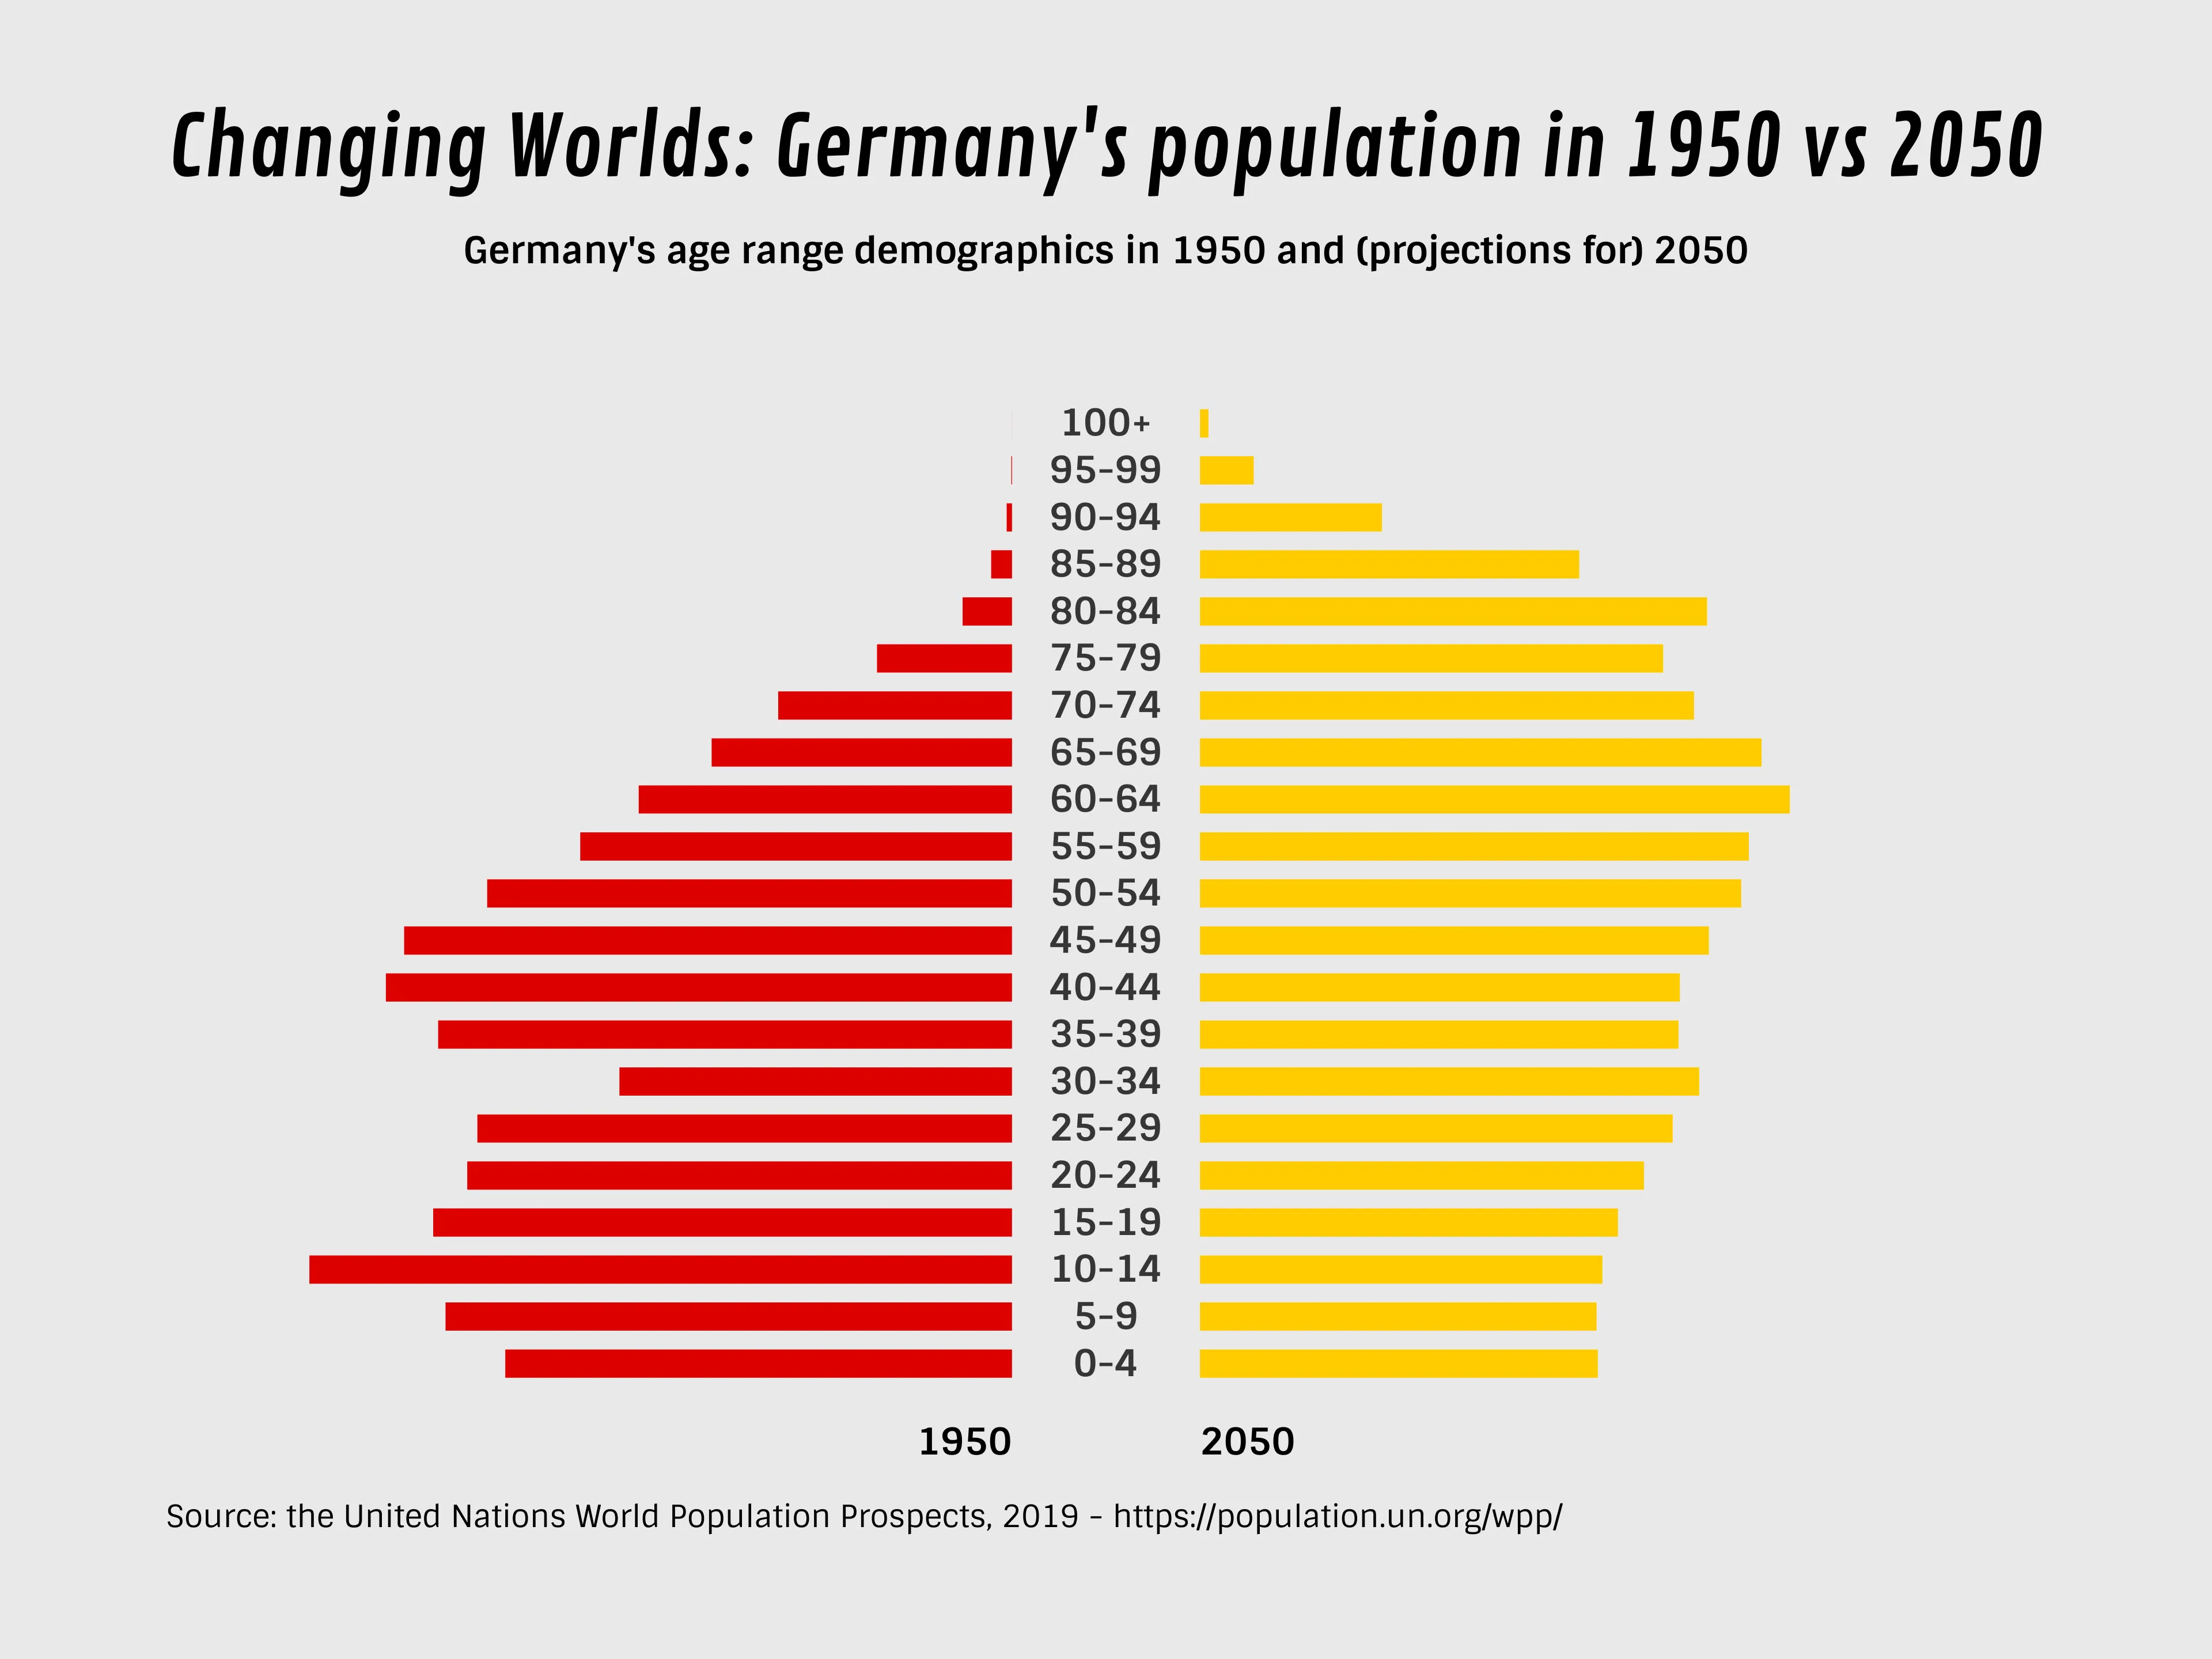
Germany’s population pyramid demographics for 2050 shows an aged population in a contracting phase, i.e. a decreasing population with an elderly majority. There are fewer children than adults–particularly over 60’s who comprise the largest demographic group, showing a major imbalance between those of working age and those beyond retirement which could cause complications for Germany’s social care infrastructure.
Though Germany’s population pyramid for 1950 generally shows a gradual expansion, there are a few anomalies. The 30-35 age group would have, just a few years before, made up the majority of the fighting force in the Second World War–explaining the sharp decrease in numbers as so many lives were lost on the battlefields. You can see the impact here on future generations: much fewer children under the age of 10 were being born as a result of the low number of men appropriately aged to begin a family.

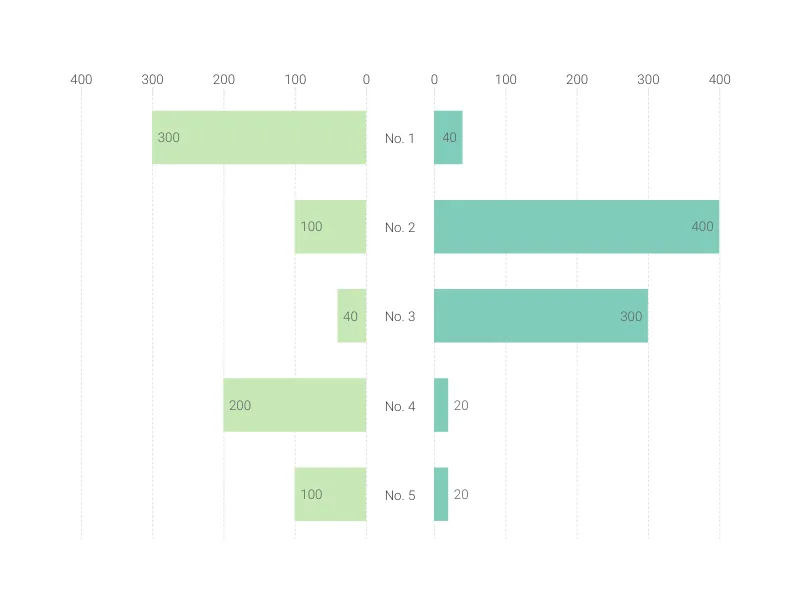
This is an example of Vizzlo's “Butterfly Chart”
Create a butterfly chart to compare two data sets side by side.