Fill out the form, and we'll get in touch as soon as possible.
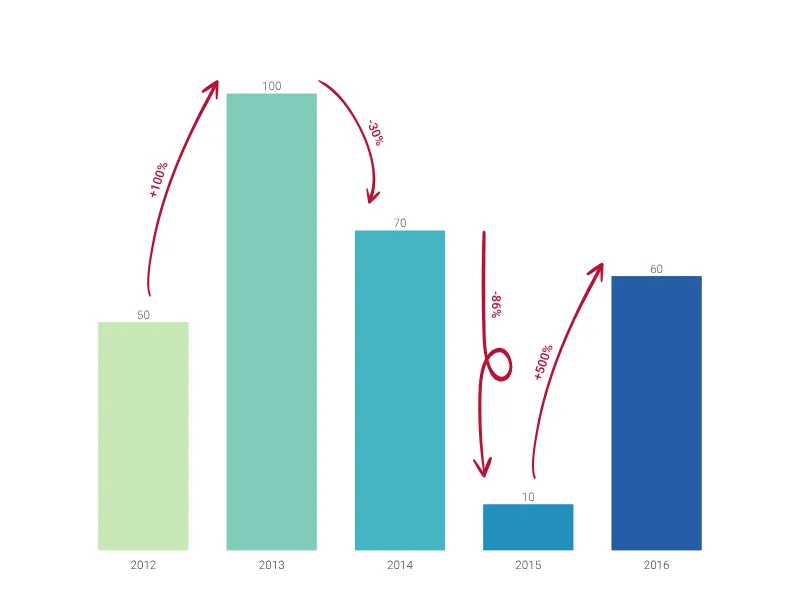
A bar chart that highlights the change from one record to the next using hand drawn arrows.
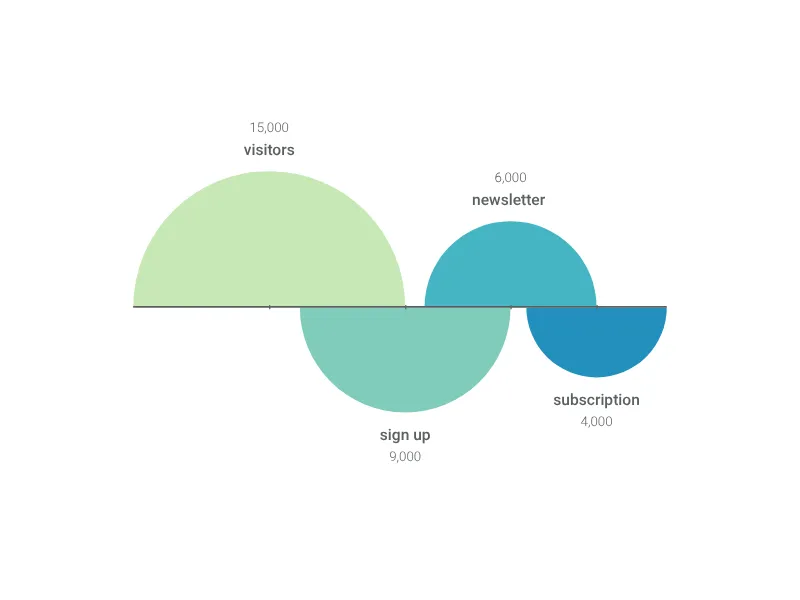
Visualize your user retention or any other simple data series using a set of sequential half circles.
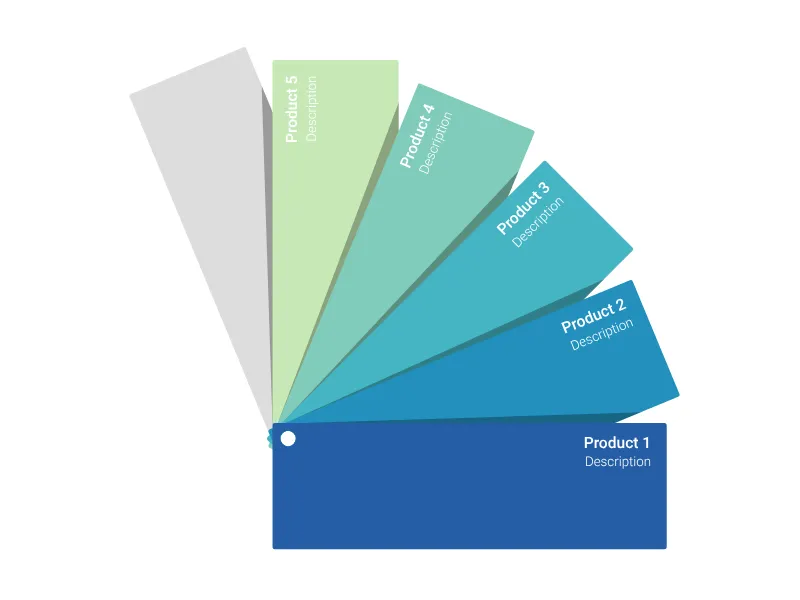
Show your corporate portfolio with this fanned-out color chart.
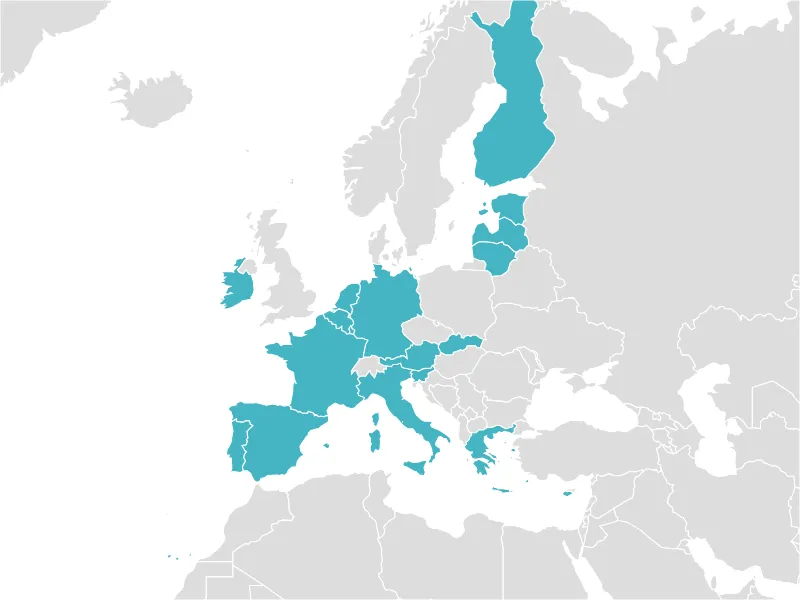
A zoomable map for highlighting any number of countries of the world by clicking on them.
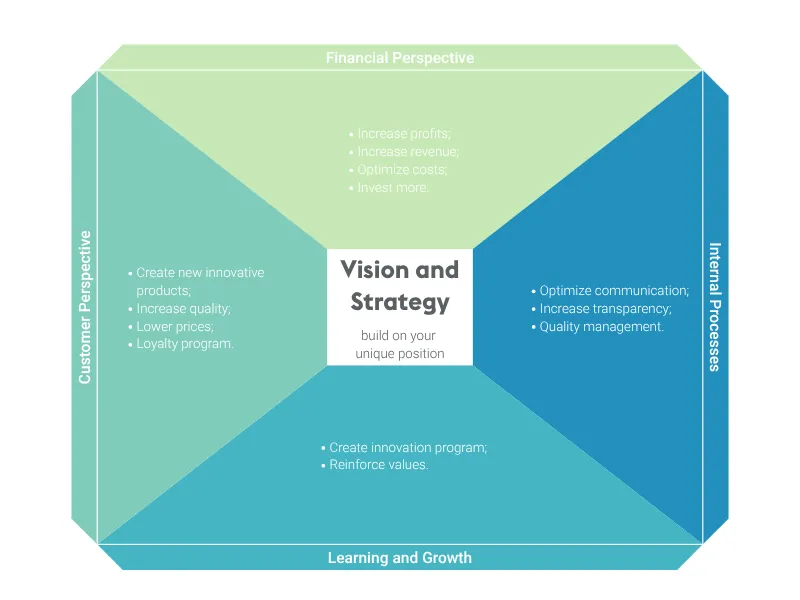
Keep track of your vision and strategy with this well-known performance management tool.
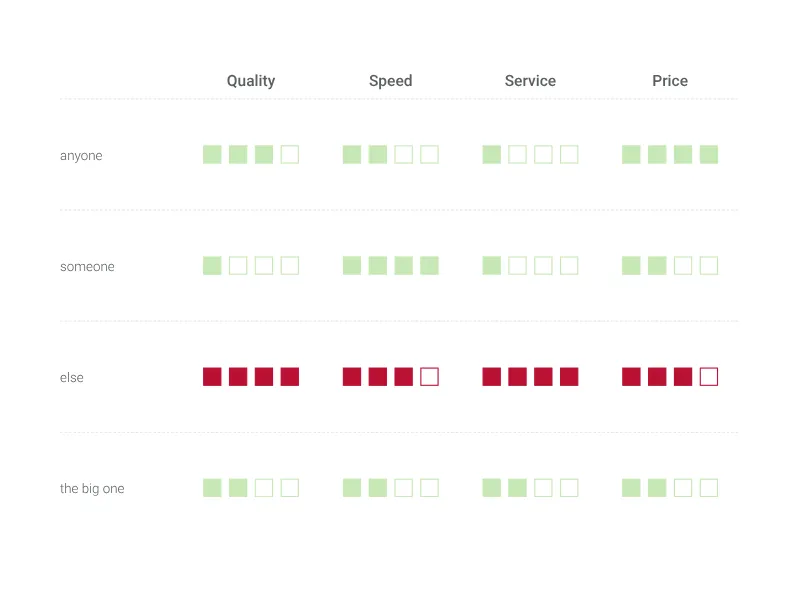
Use this table to compare product features or skills, and tell at a glance which option suits you best.
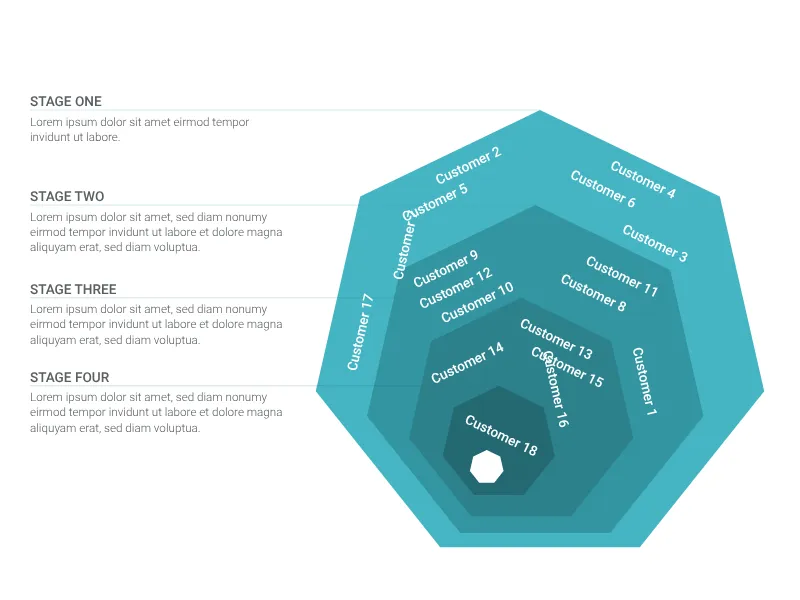
A fantastic representation of a funnel chart from the top of it. Perfect to represent the stages of your sales process!
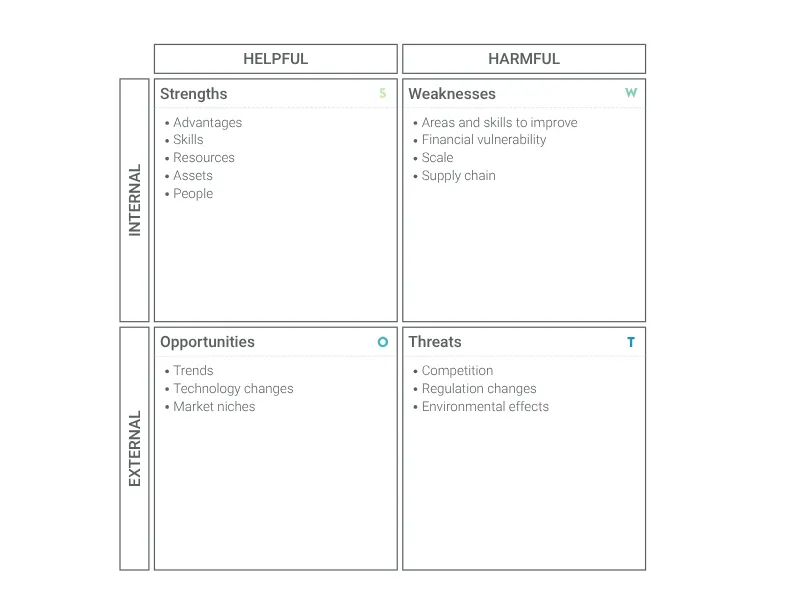
Easily visualize your business strengths and weaknesses, and identify opportunities and threats.
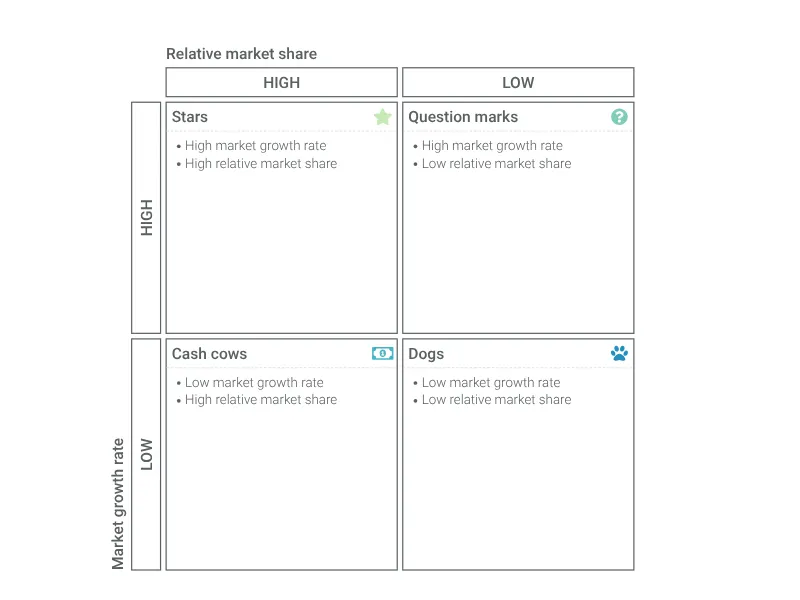
Carry out a portfolio analysis to help you allocate resources efficiently and devise a successful business strategy.
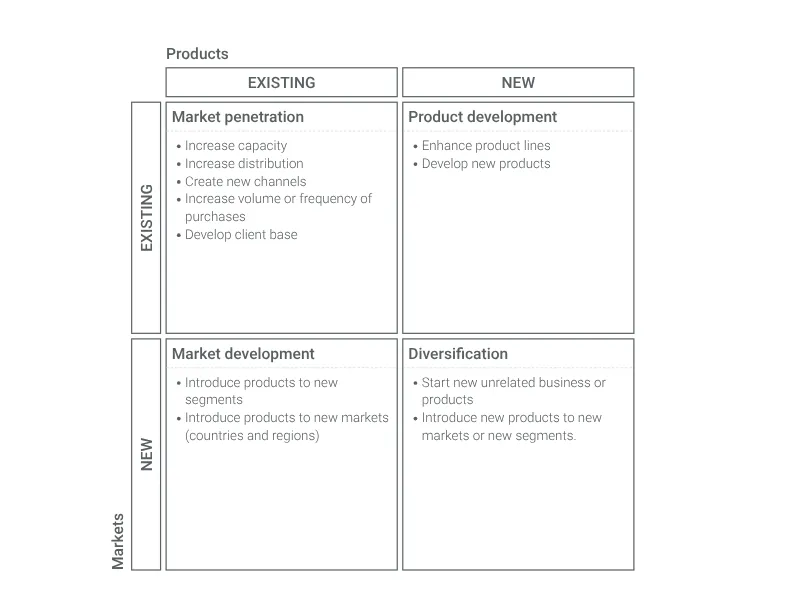
Visualize product- and market-related opportunities to define your growth strategy.
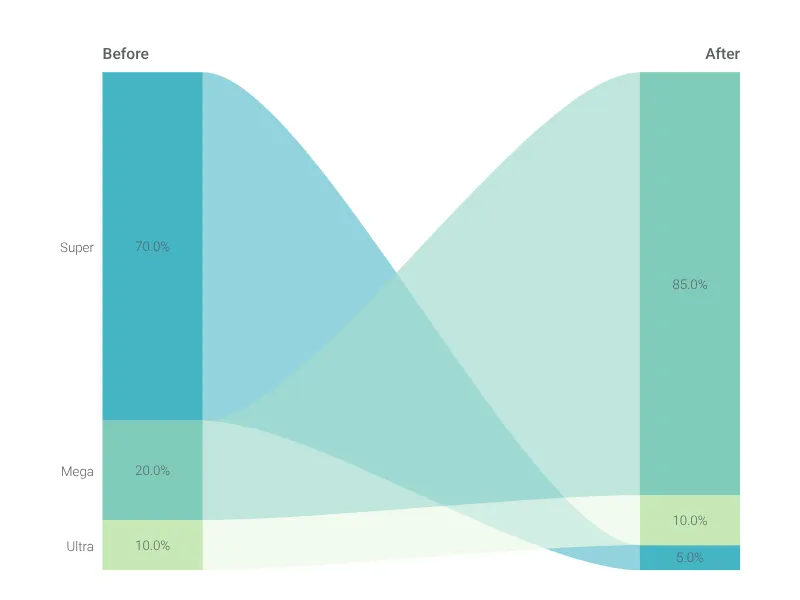
Use a value projection to compare the values of different categories in two different moments.
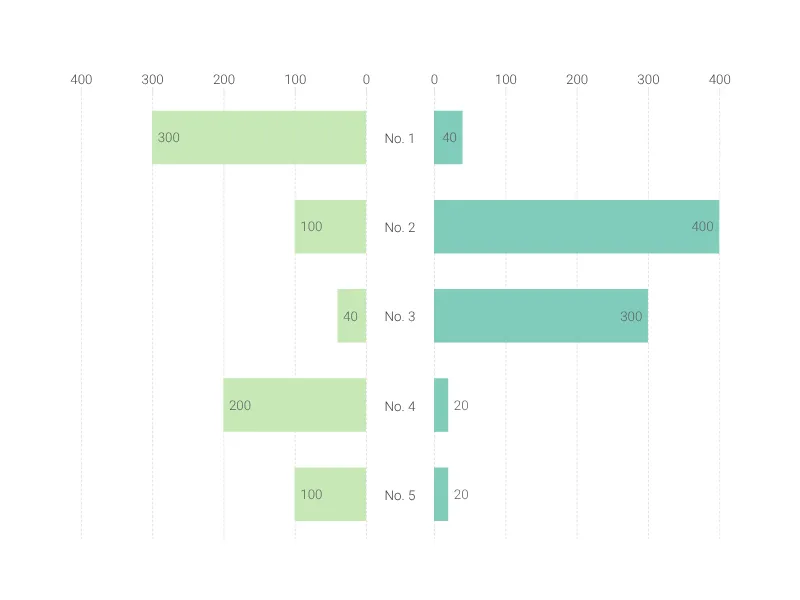
Create a butterfly chart to compare two data sets side by side.
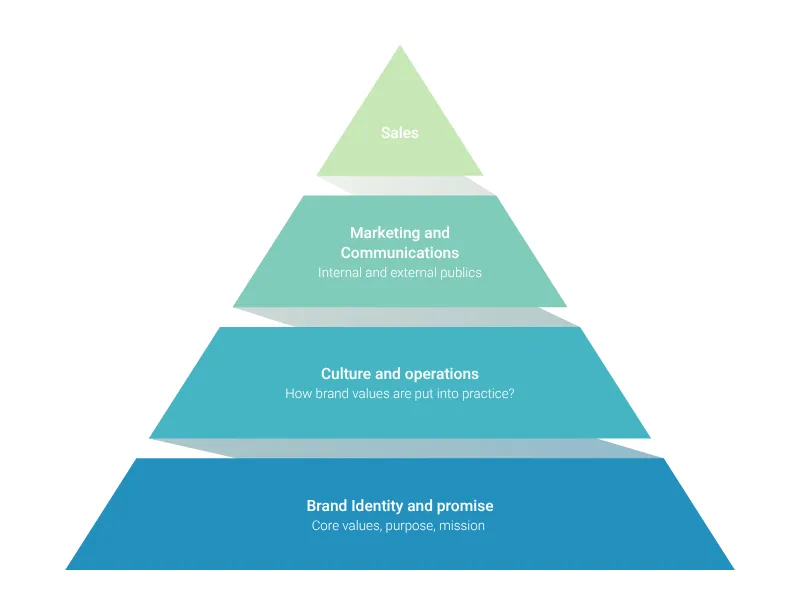
A beautiful and highly customizable pyramid diagram with up to ten levels.
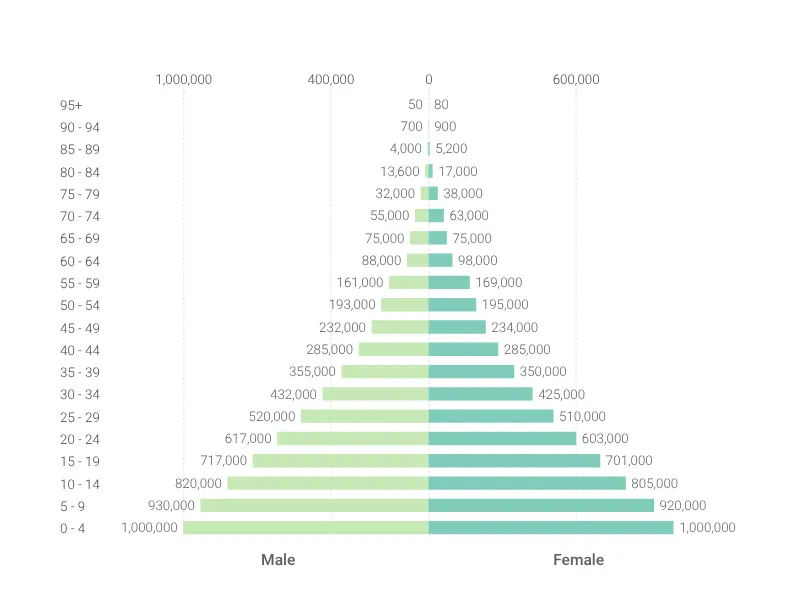
Break down demographics with this population pyramid.
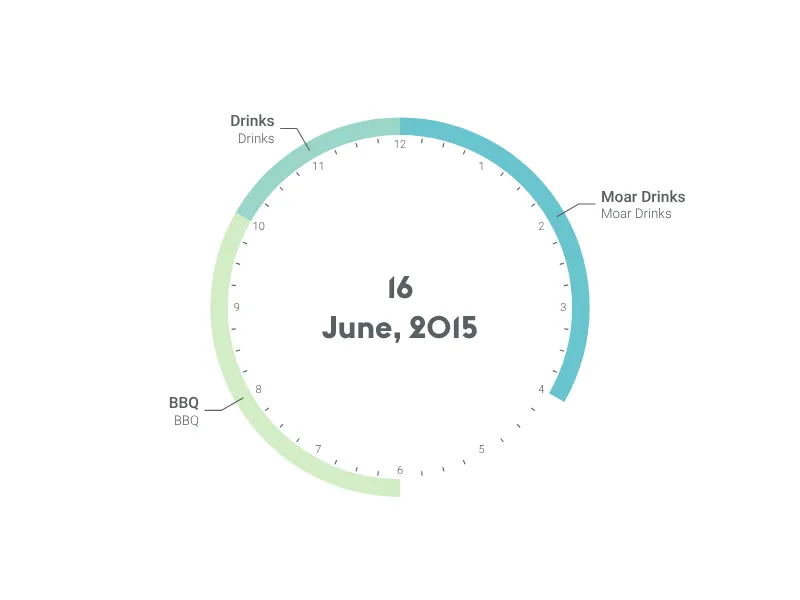
Plan a whole year or a day, or quickly display recurring activities/events with this beautiful agenda chart.
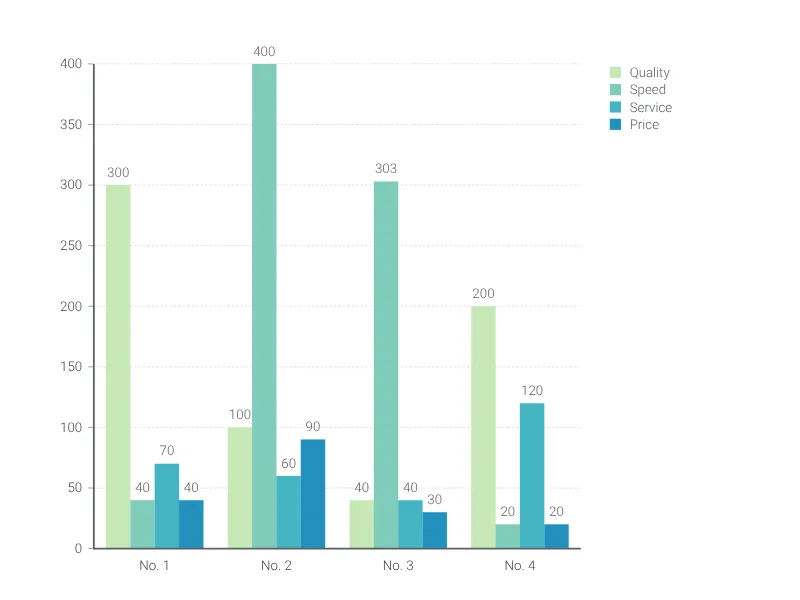
Use a grouped bar chart to compare the same categories within different groups.
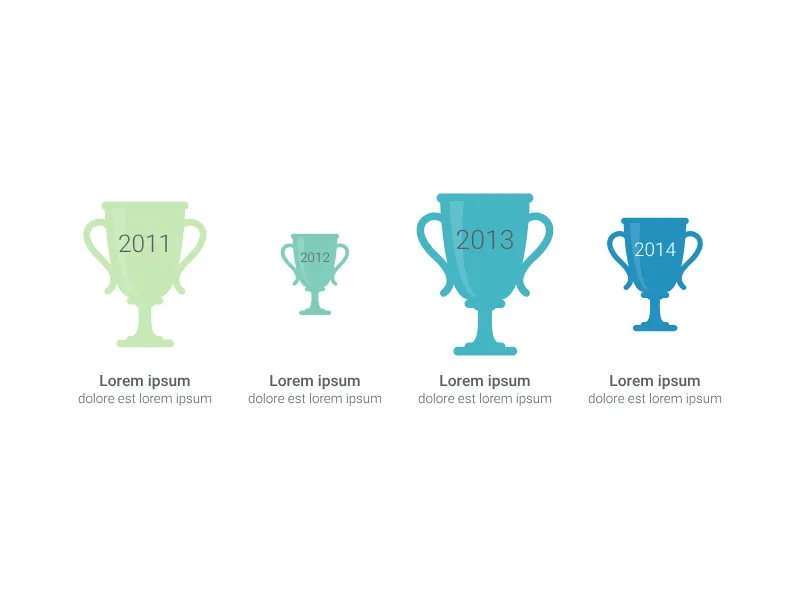
Won a prize or some other trophy in a competition? Show how proud you are.
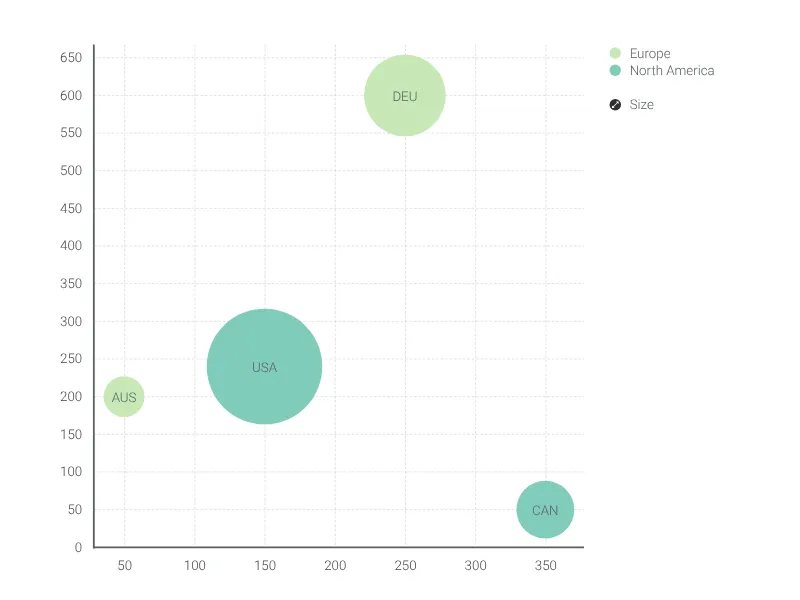
A multivariable graph for visualizing and comparing up to four dimension of your data.
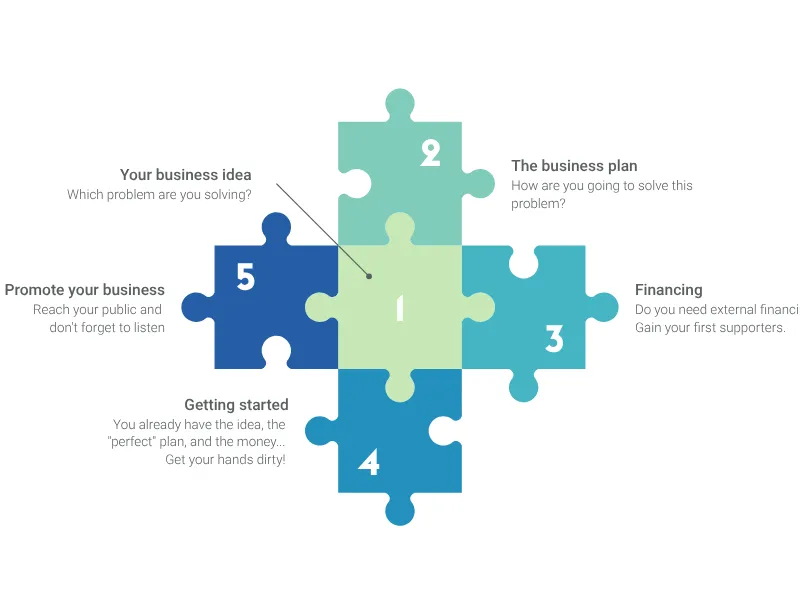
Piece processes or elements of a project together with this puzzle chart.
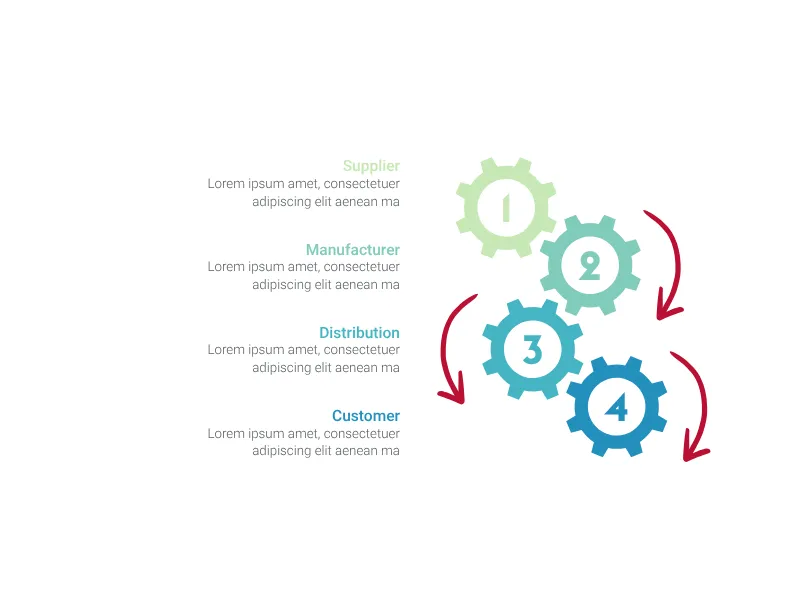
This gearwheel chart perfectly fits your relationships in business processes.
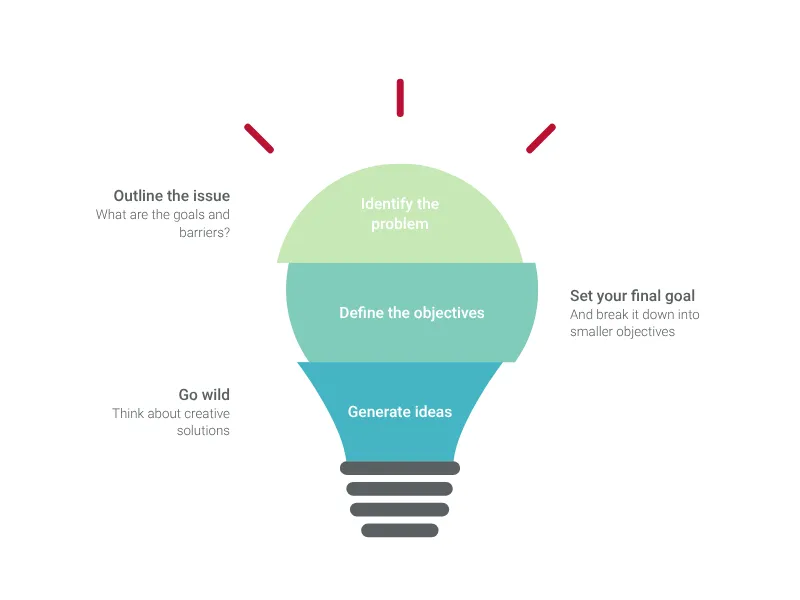
Visualize your ideas and core beliefs with this great staged light bulb graphic.
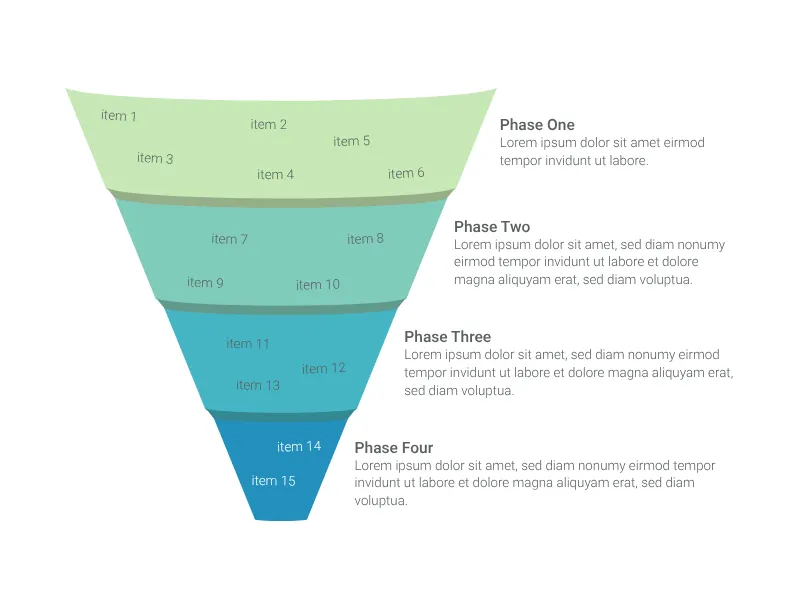
Create a beautiful funnel chart with up to six stages to map out your sales pipeline or any other process.