Chart Vizzard
Vizzlo's AI-based chart generatorJapans Population growth: 1950 vs 2050

Part of our Changing Worlds population pyramid series.
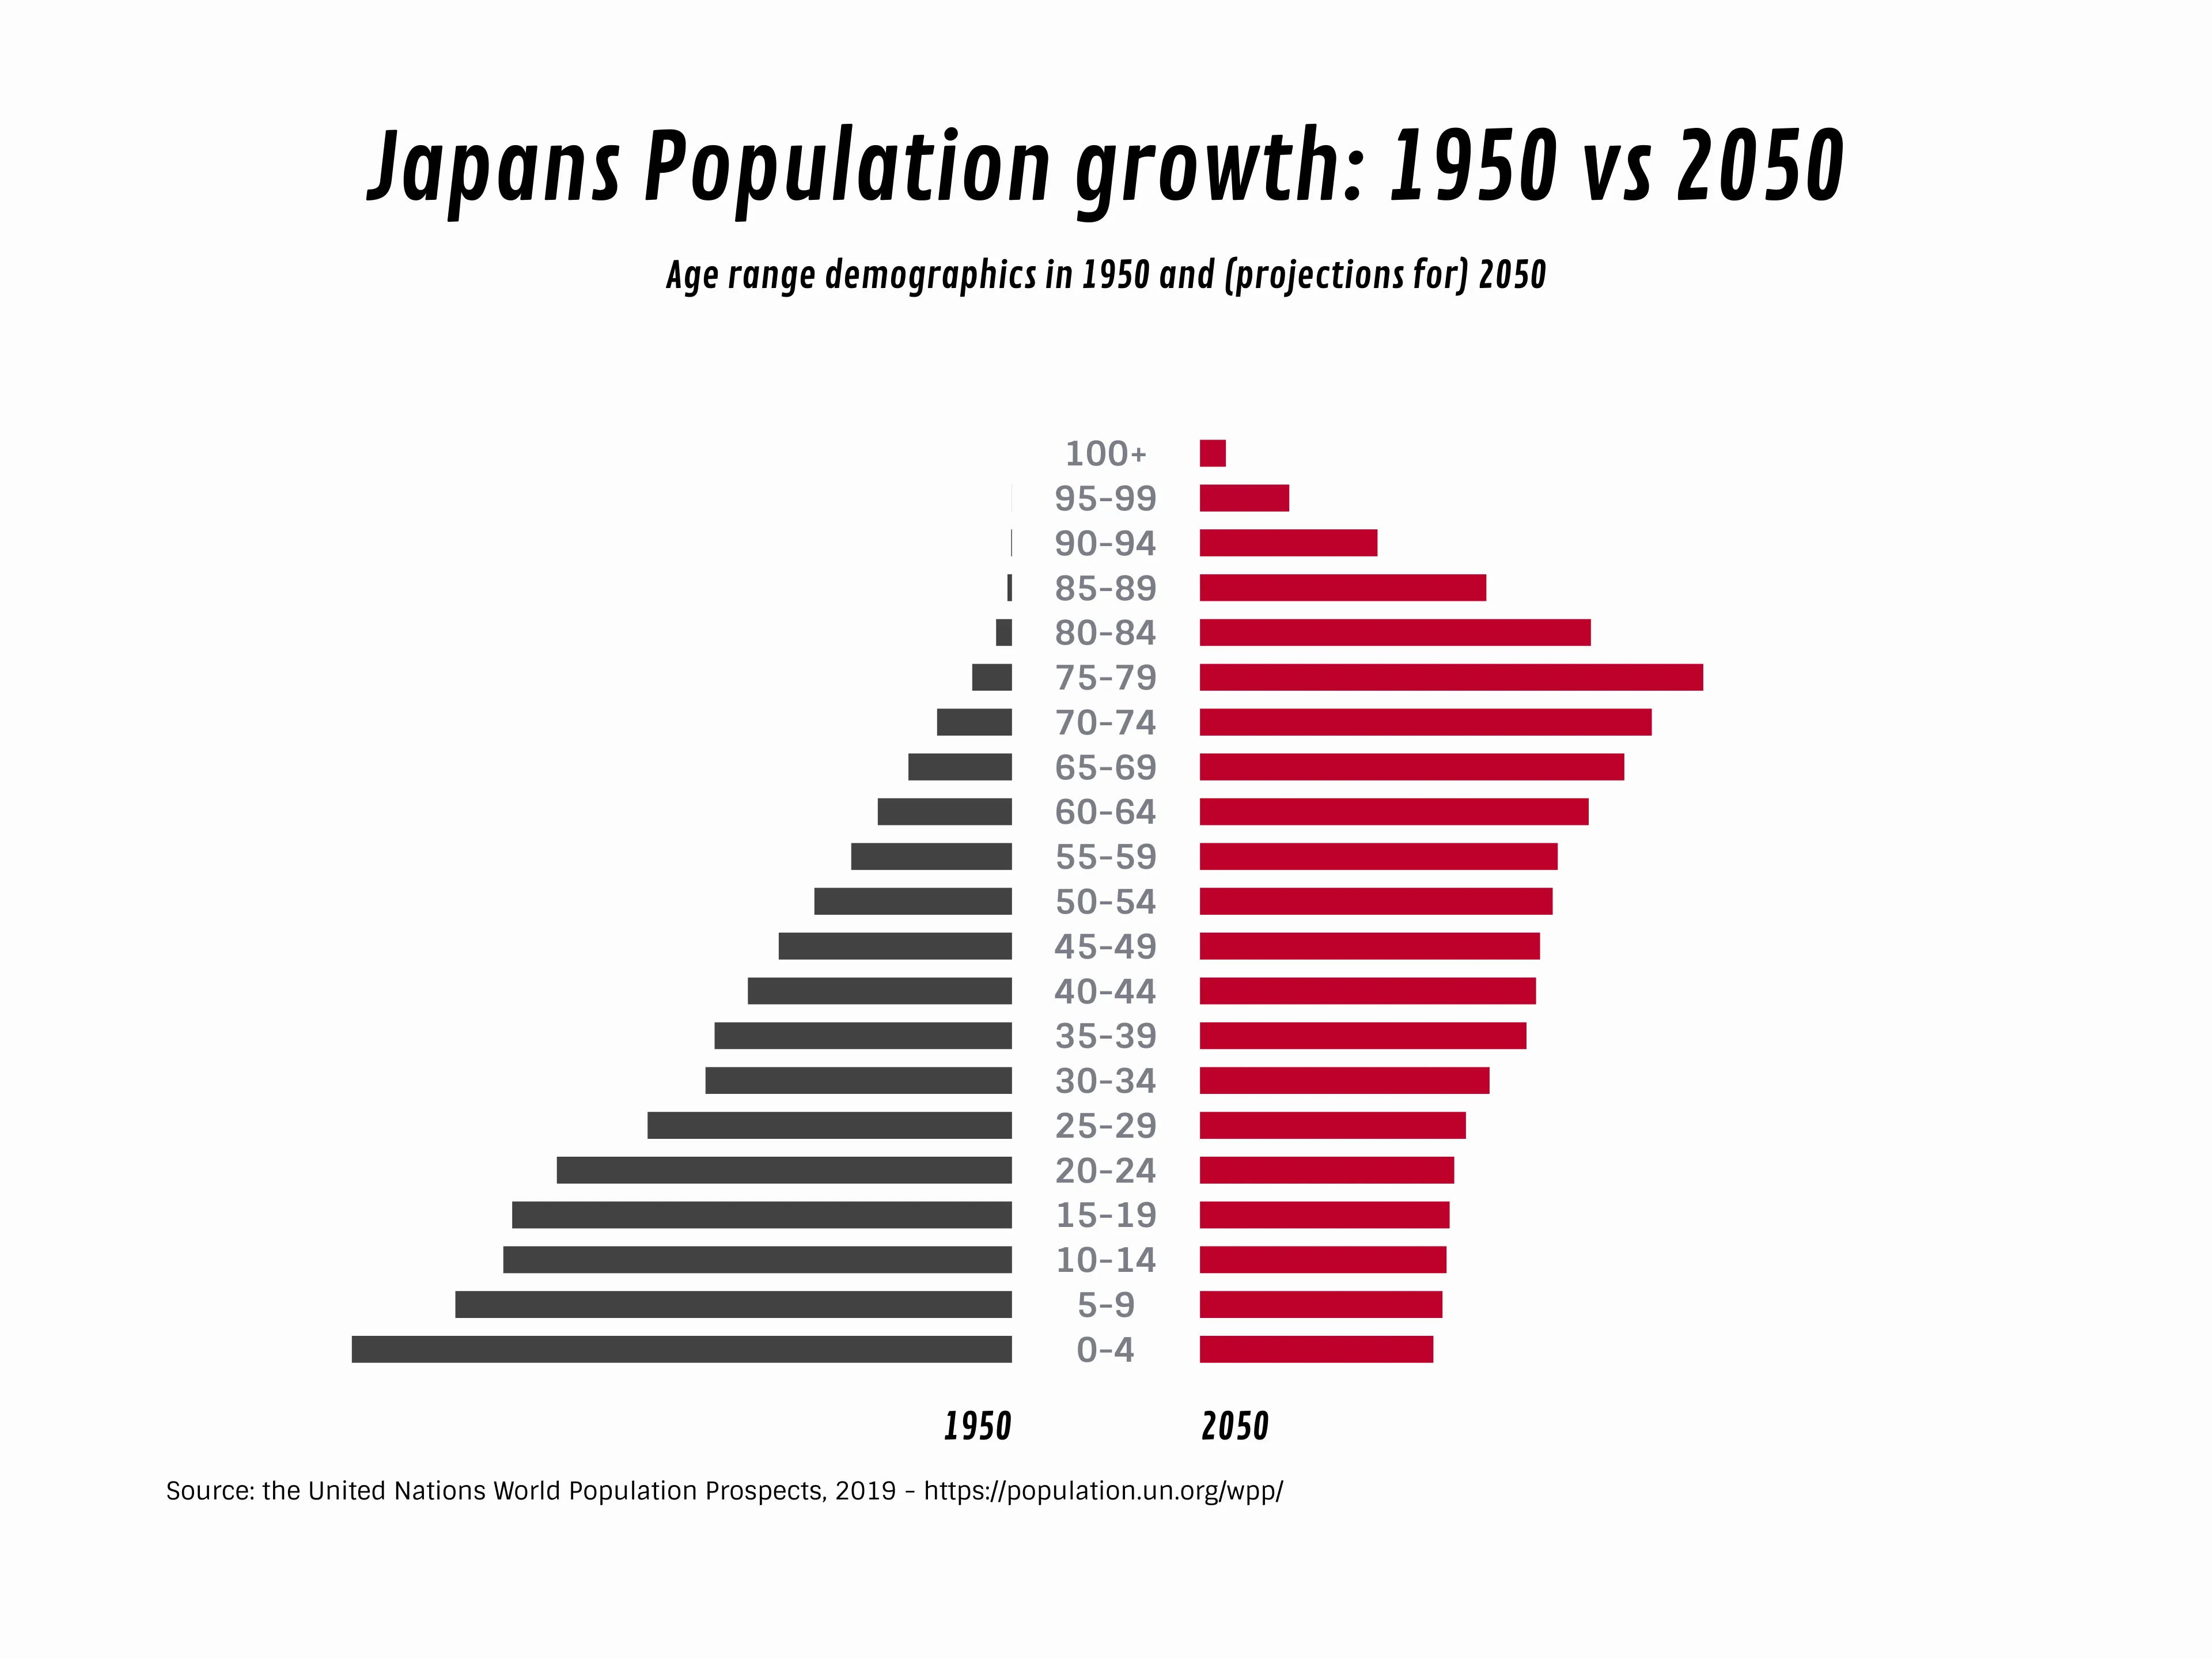
Perhaps the most drastic change in age demographics of any country we have reviewed for this feature, Japan’s population breakdown is almost unrecognisable from 1950.
Though the effects of World War II were still being felt in Japan at the time of the left side of the population pyramid, the country’s economy recovered rapidly, causing this period in Japan to become known as the ‘Economic Miracle’.
Investment in education for the huge proportion of the population under 20 made a significant difference in Japan’s ability to nurture highly skilled workers and become a global leader in technology.
In 2050, we see almost the opposite demographic distribution, with the highest proportion of Japan’s population aged 75-79. This category is more than double the number of children being born–which could lead to a state emergency in social care for the elderly.

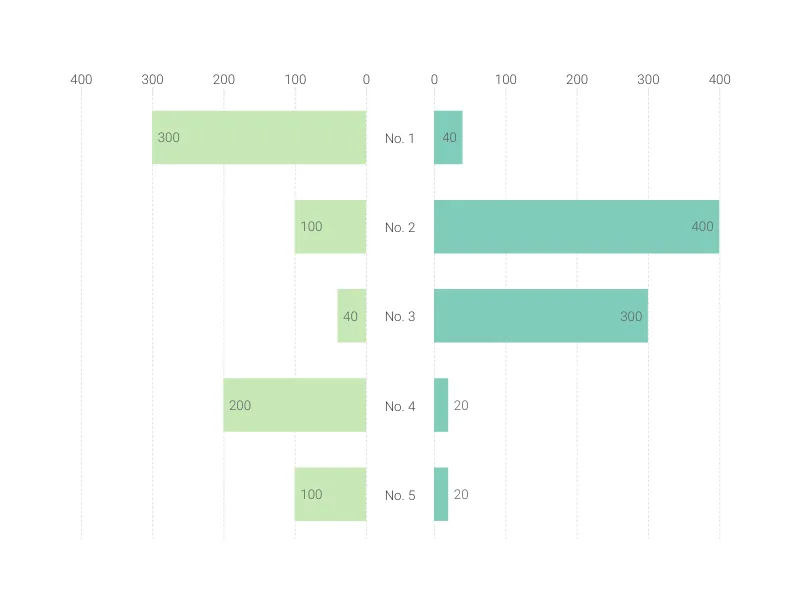
This is an example of Vizzlo's “Butterfly Chart”
Create a butterfly chart to compare two data sets side by side.