Chart Vizzard
Vizzlo's AI-based chart generatorEmployee Satisfaction Scores, 2020

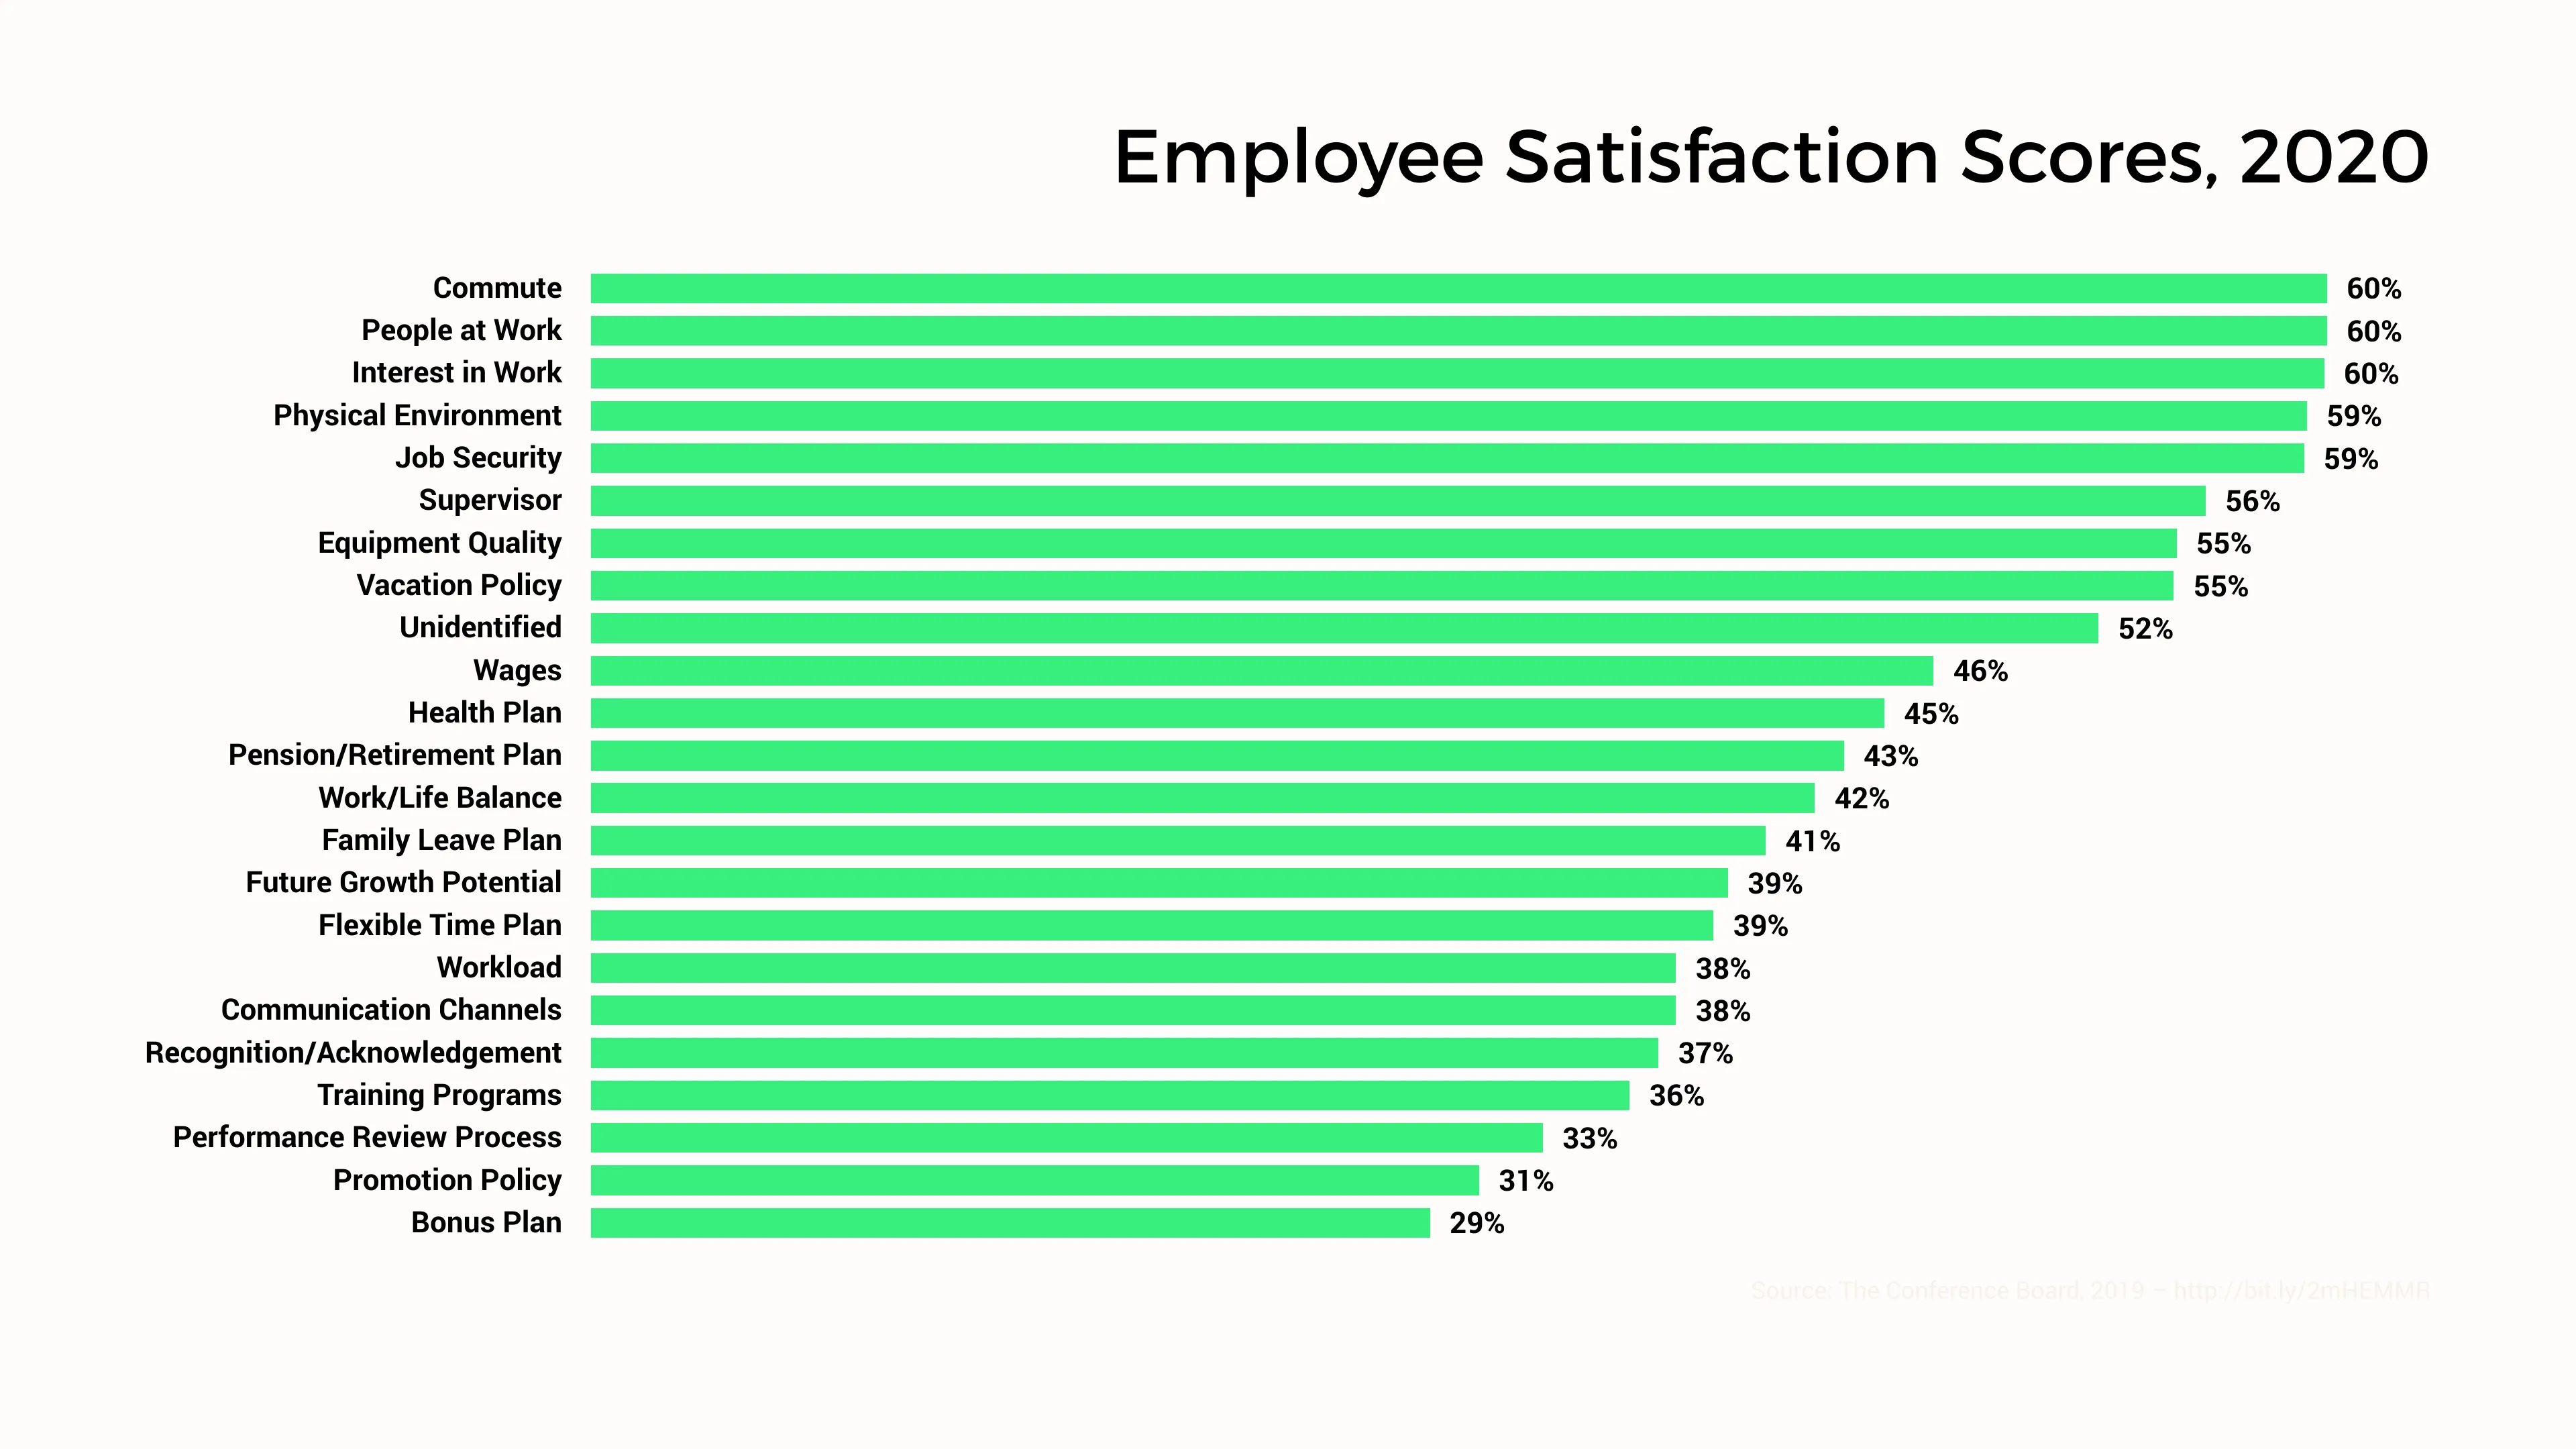
Overall, people are more satisfied at work than ever before–thanks mostly to environmental factors, whether that be colleagues and superiors at work, the office space itself, or the convenience of work location.
All these areas (and everything else in white) scored over 50% in employee satisfaction ratings, so we know the majority of workers feel good about the efforts that have been made in these areas.
However, as the job market settles and almost 60% of employees feel a good level of job security, this also means that employees are more likely to move to another role if dissatisfied. Making areas which most companies are scoring lowest in (everything in black) a priority to work on can help you retain key employees and attract new talent.
Invest in: -Flexible working -Internal growth, from concrete plans to promote, to training courses that help employees level-up their skills -Communication processes, including regularly scheduled 121 performance reviews -Realism with workload expectations… or if you can’t do that, a Christmas bonus wouldn’t hurt ;)

This is an example of Vizzlo's “Horizontal Bar Chart”
A horizontal variant of the classic column chart.