Chart Vizzard
Vizzlo's AI-based chart generatorWorld Economic Forum

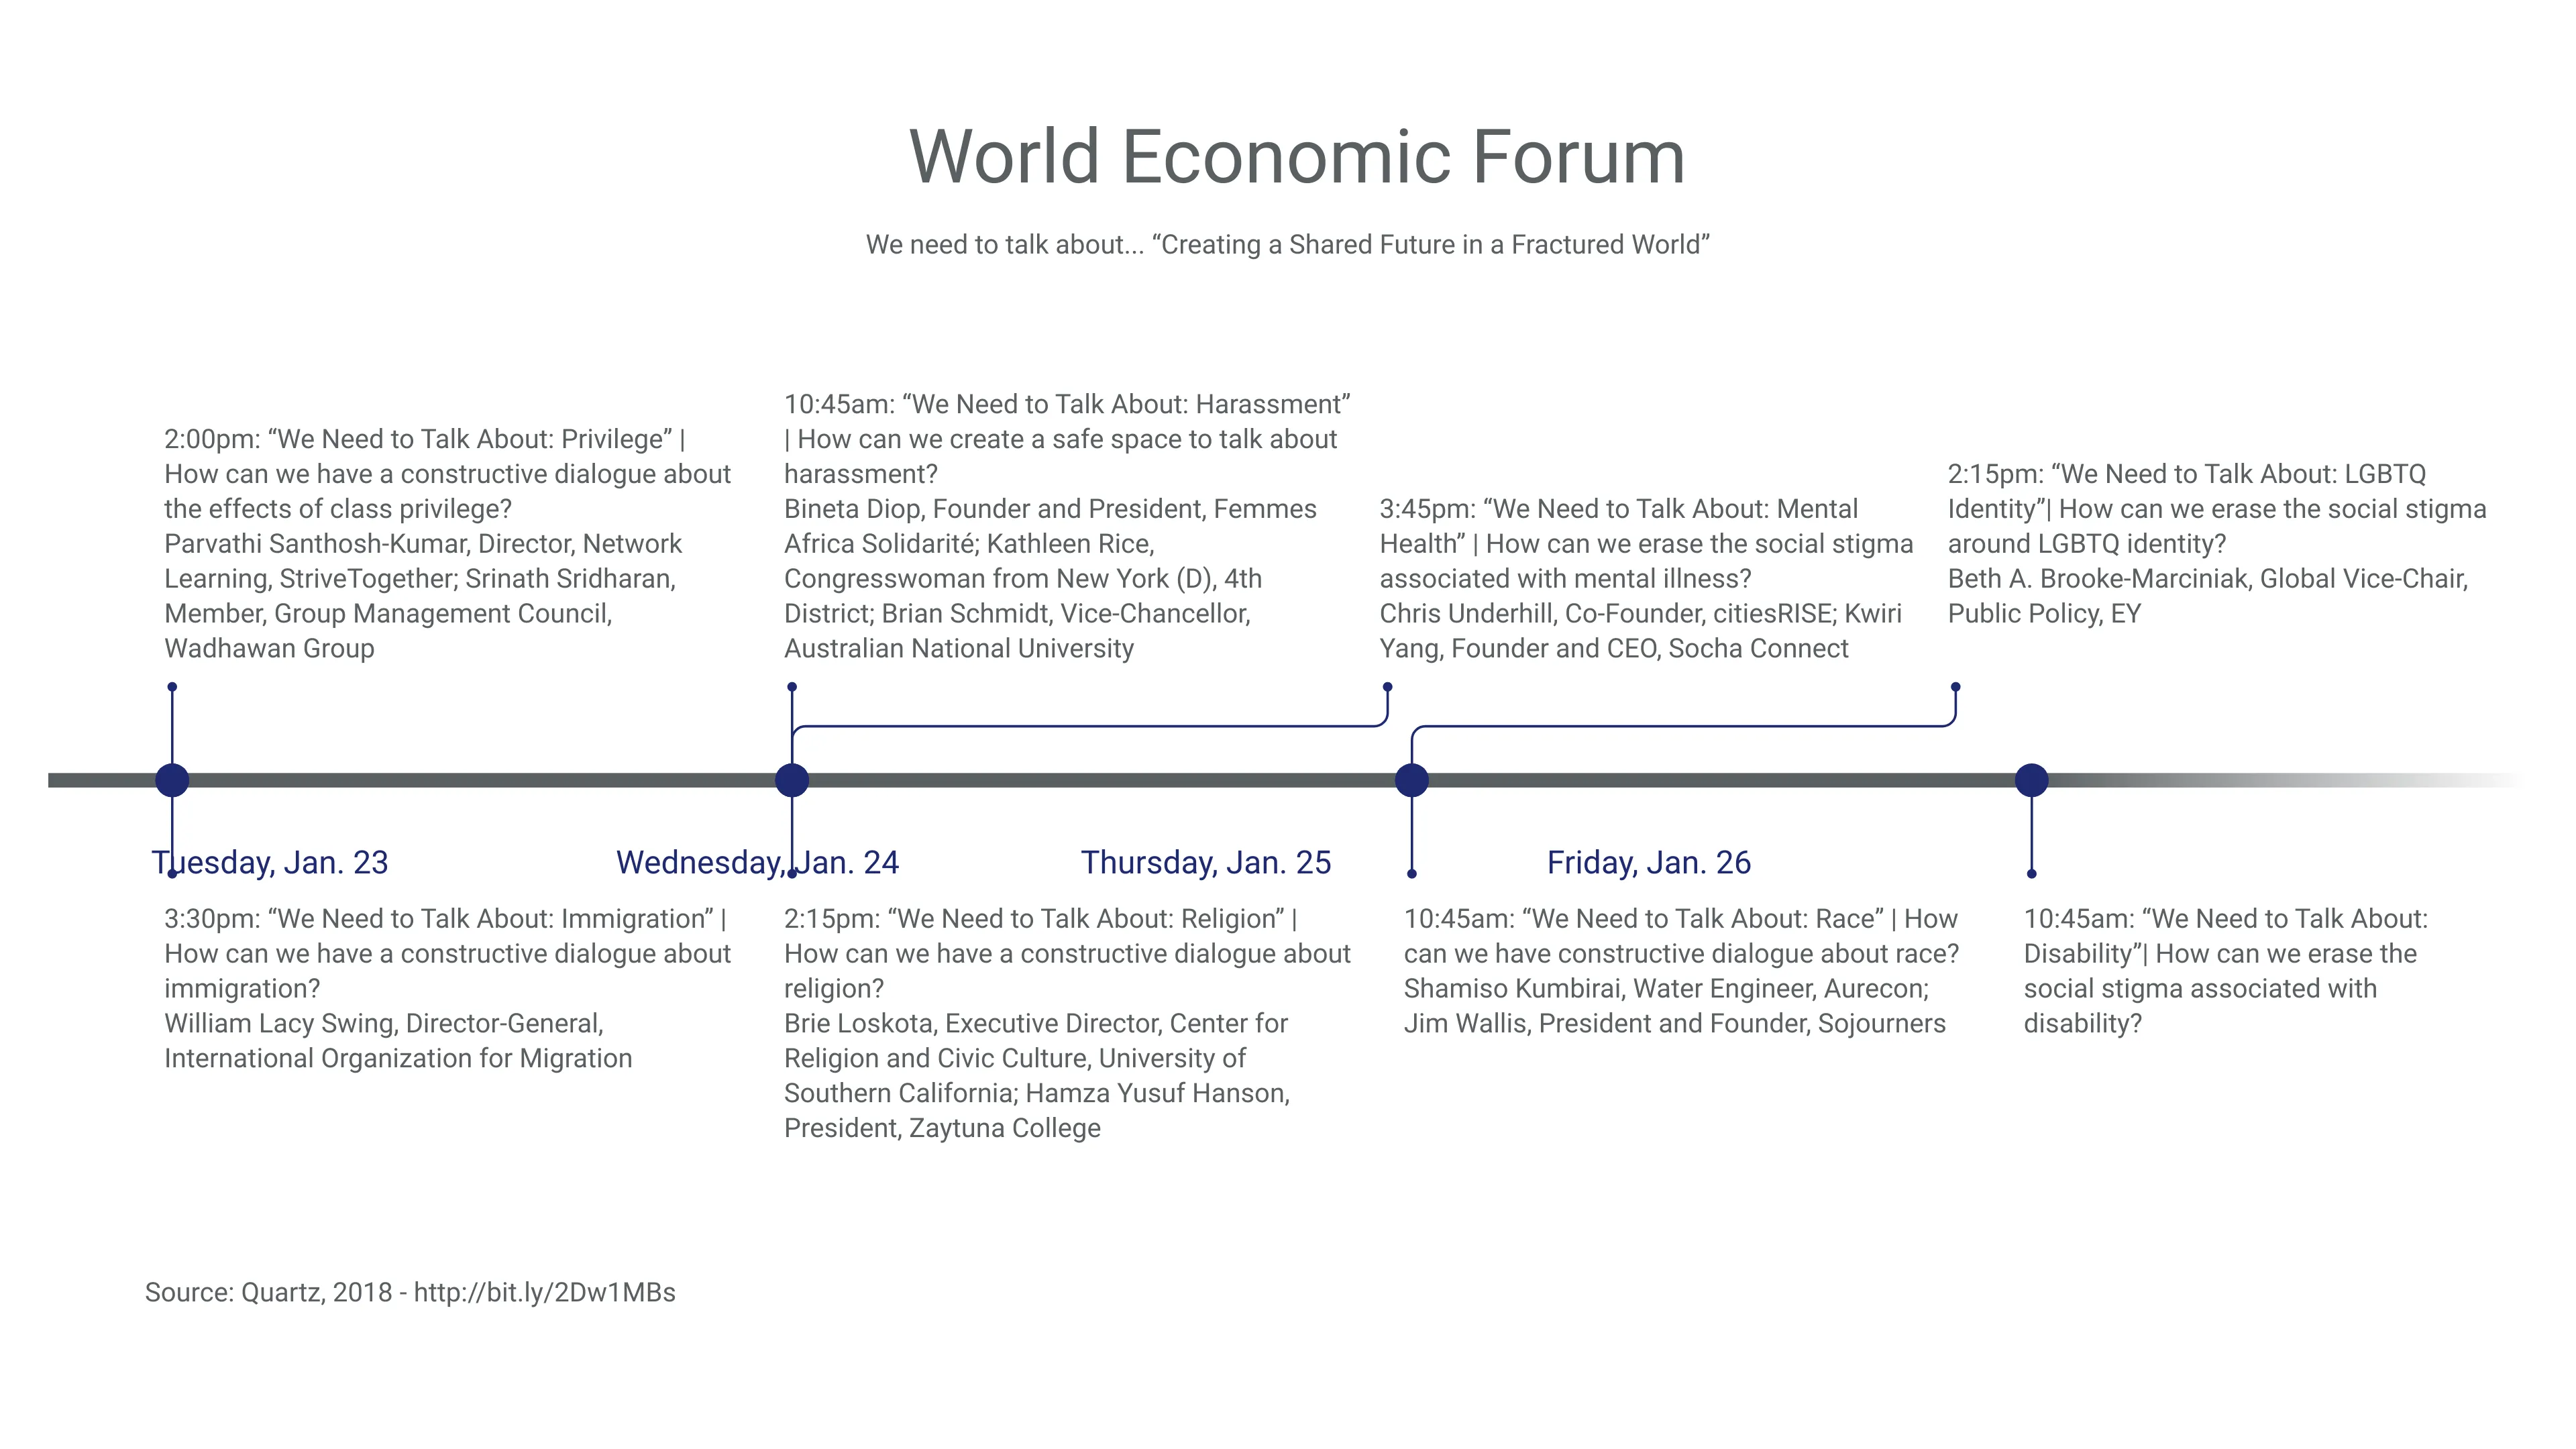
Parallel to the main panels of the [World Economic Forum 2018 — Creating a Shared Future in a Fractured World] (https://www.weforum.org/events/world-economic-forum-annual-meeting-2018), Davos planners created a series of small yet telling sessions to discuss different forms of inequality and exclusion. Because Davos is mostly critized for being an exclusive gathering of globalist elites, these sessions are interpreted as a discrete response to increasing social pressures. These are the topics they think [we need to talk about] (http://bit.ly/2Dw1MBs).

This is an example of Vizzlo's “Timeline Chart”
Efficient project planning and scheduling with impressive timelines with just a few clicks.
Project Management Time-based charts Milestone Charts Timelines & Roadmaps