Chart Vizzard
Vizzlo's AI-based chart generatorMarch 12, 2026 • 3 min read
How to turn any TV into a live KPI dashboard
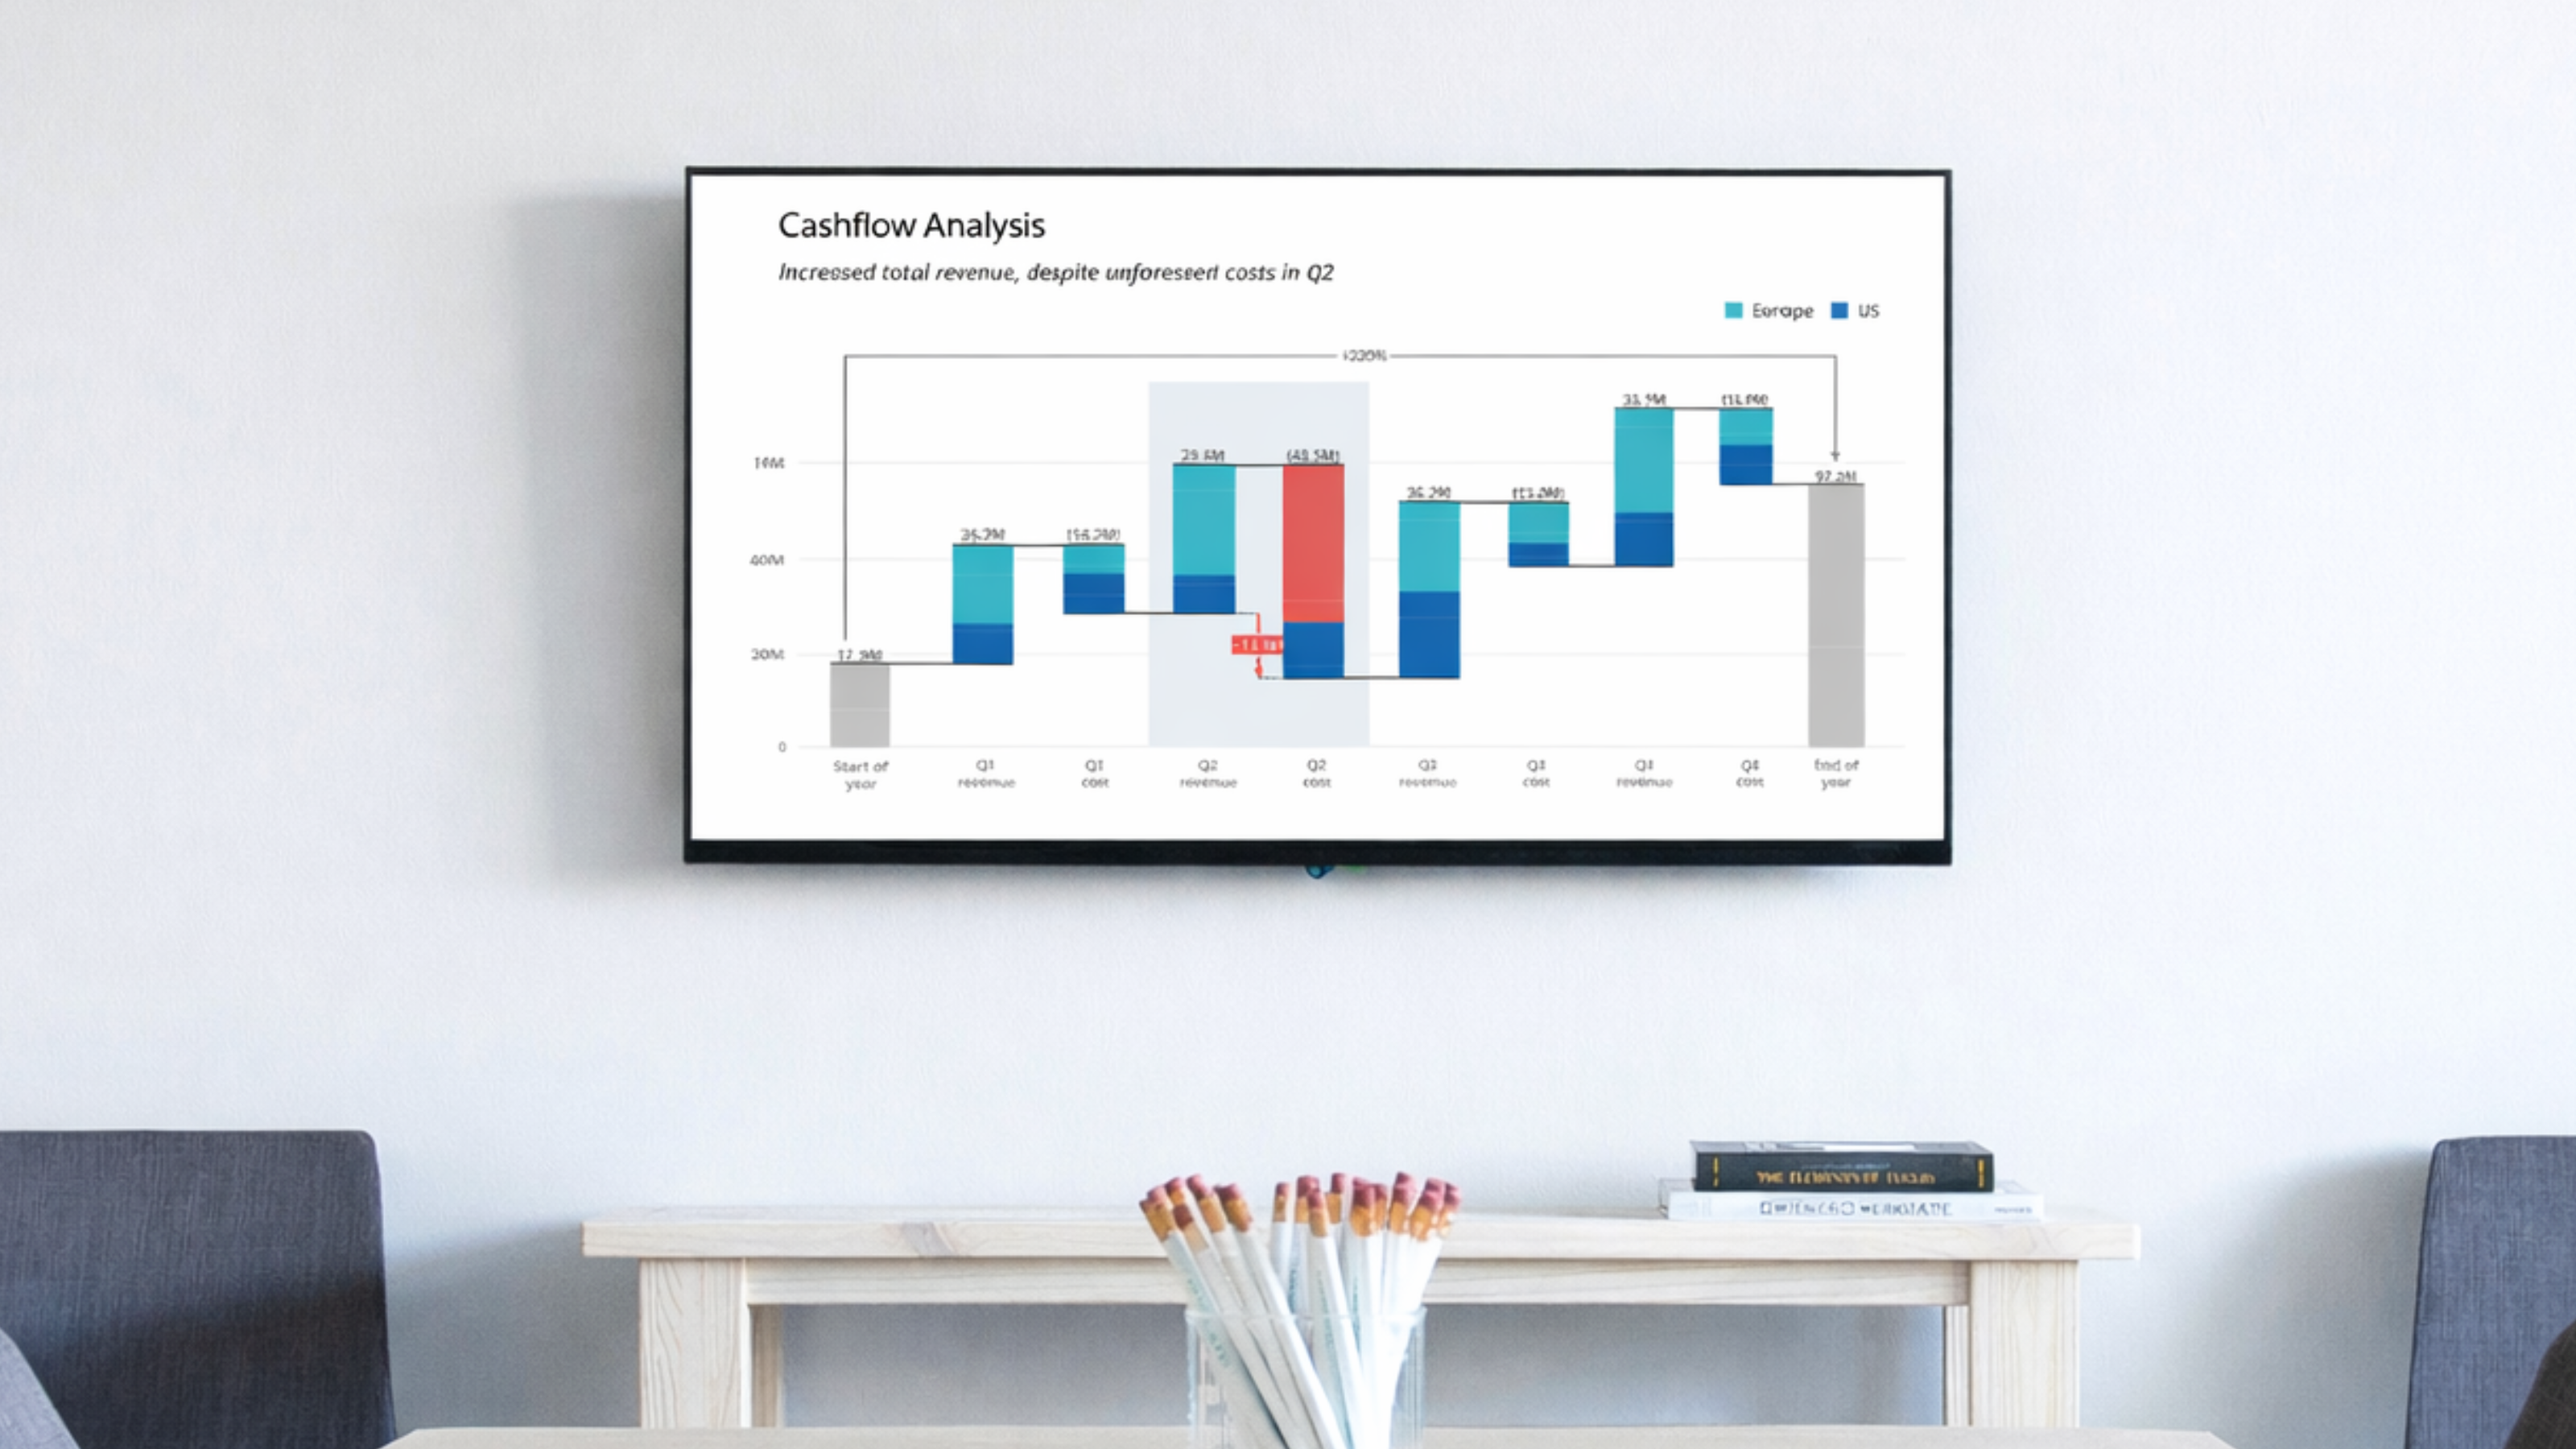
These days, we stream almost everything to our TVs, from series and movies to music. In most offices, screens are constantly on, showing presentations, video calls, or simply sitting idle between meetings. And yet, while streaming entertainment is effortless, displaying a live KPI dashboard on that same screen still feels harder than it should.
Many teams want their key metrics visible on office TV screens throughout the day, whether it is sales numbers in the sales room, marketing performance in a shared space, or project timelines running in meeting rooms. A live KPI wall keeps everyone aligned.
In practice, setting up a real-time dashboard on a TV often means keeping a laptop permanently connected, mirroring a browser tab, exporting images manually, or using separate digital signage software.
We wanted to make this easier.
Cast your chart in one click
You can now cast any Vizzlo chart directly from the editor to a TV or external display. Select the “Cast” option in the “Present” dropdown menu, select a screen, and your chart opens full screen. In Chrome and Edge, casting works with Google Cast-enabled TVs or connected Chromecast devices. From that moment on, it updates automatically whenever the chart changes. There is no need to keep your laptop connected, and no one has to refresh the screen manually.
The display becomes an independent, live KPI dashboard that always shows the latest saved version. You can close the editor, switch devices, or let collaborators continue working. The TV stays in sync.
No cables. No mirroring.
This is not traditional browser mirroring.
With mirroring, the source device must stay on and connected. If the laptop disconnects, the screen goes blank.
With Vizzlo casting, the dashboard loads directly on the display and keeps itself updated. It is a cleaner and more stable solution for always-on office dashboard screens.
Whether you are setting up a KPI wall for your sales team, displaying marketing dashboards in a shared workspace, or showing project timelines during meetings, casting makes it simple to display dashboards on TV screens without extra tools or complex setup.
What you need to cast a chart
To cast a Vizzlo chart, currently you need Google Chrome or Microsoft Edge and a Google Cast-enabled display. This can be a TV with Google Cast built-in or a Chromecast device connected to the TV.
Google provides an overview of supported devices in its official documentation:
https://support.google.com/googlecast/answer/3006709
For the initial set-up, both devices need to be connected to the same network. Once the chart is cast, the display loads the chart directly and stays updated whenever the chart is saved.
Open a document in the editor, cast it, and go.
Happy charting.