Chart Vizzard
Vizzlo's AI-based chart generatorMarch 8, 2018 • 4 min read
Visualizing your business strategy has never been easier

How often have you wanted to visualize your business strategy and spent more time finding the right way to chart it, instead of working on your project?
It takes a lot of effort to transform your ideas into actions, especially when it comes to going over current strategies or potential expansion plans. This is precisely where our new three analysis Matrixes come into play. Vizzlo to the rescue! Saving you valuable time for your strategic planning.
Introducing: SWOT Analysis, Ansoff’s Matrix, and BCG Matrix
Investors, analysts, portfolio and project managers, among other professionals; use these tools to compare their company or product to the industry around it. They will help you visualize what to improve in your different business units, or where to grow to, taking into consideration your advantages and weaknesses towards your competition.
SWOT Analysis
Also known as: SWOT Matrix.
SWOT is an acronym for Strengths, Weaknesses, Opportunities, and Threats. This analysis does precisely that: it helps you with strategic planning by identifying those internal and external aspects of your business and its environment. It will come in handy with any decision-making situation where the objective of your efforts has already been established.
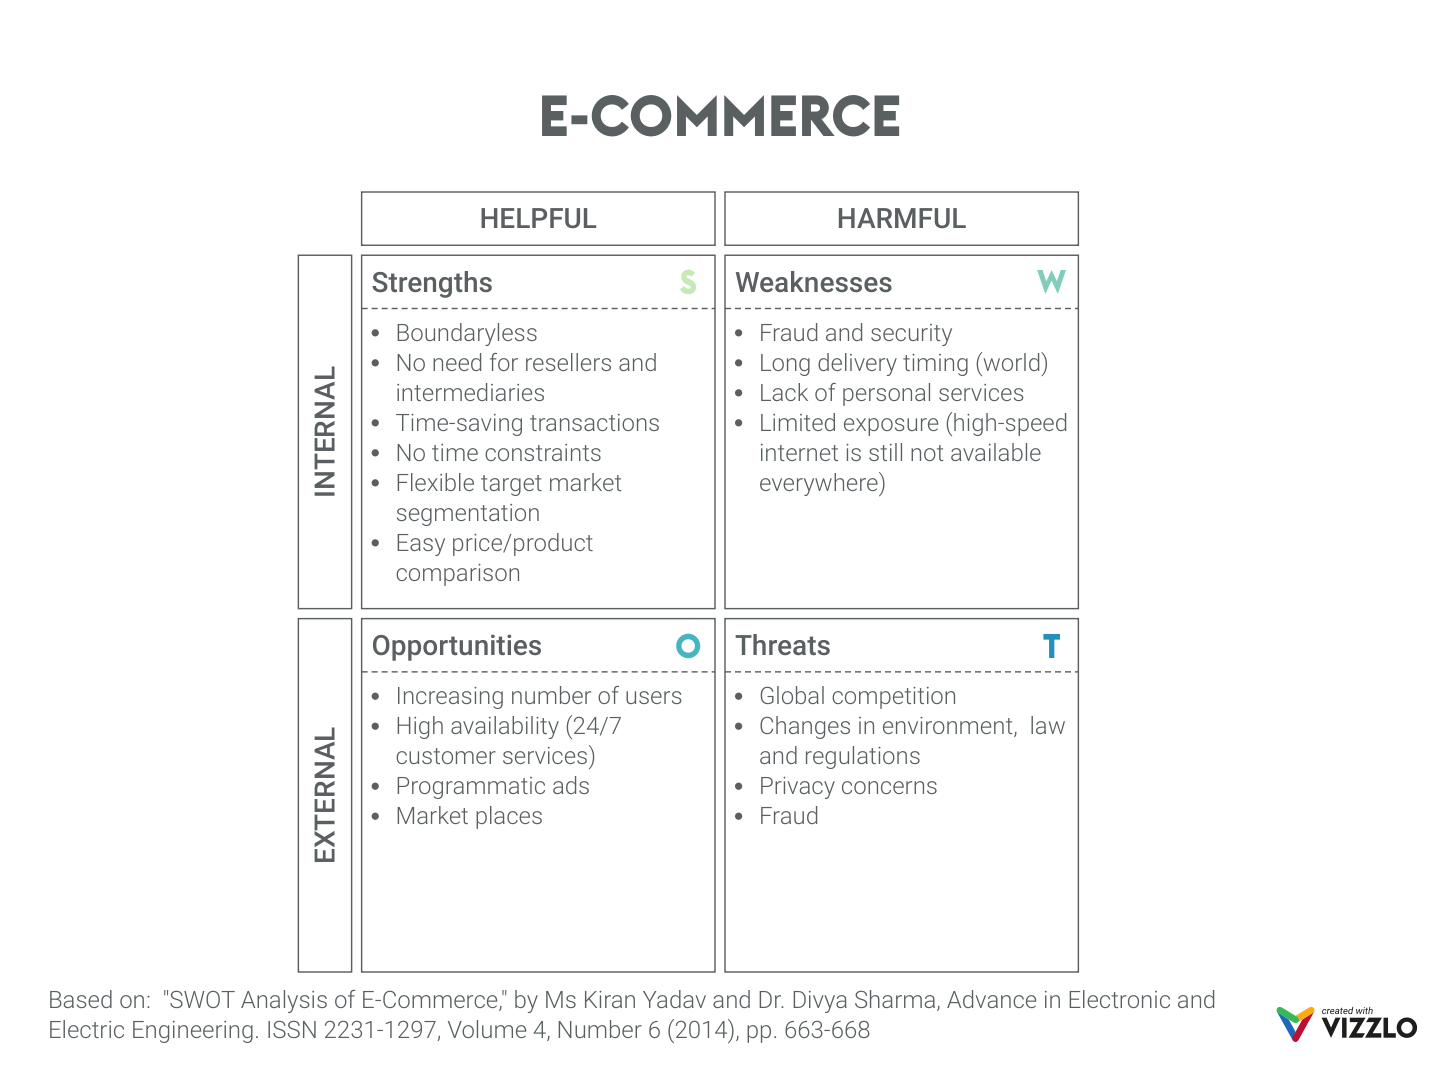
This matrix will give you a compelling scan of the environment you are swimming in, and this should lead to an informed decision within your business strategy. It can help you find creative solutions to current problems, identify limits and goals to work with, and expose areas of opportunity; among other useful applications. It also makes it very clear for teams, which characteristics are within reach and can be changed, and which ones are dictated by external factors.
PRO TIP: Once you have these four aspects identified by this 2x2 matrix, you might want to try one of the different strategies to make use of this information. One could be to match strengths and opportunities to create competitive advantage. Another option is to concentrate your efforts on turning weaknesses or threats into strengths or opportunities.
Start your own SWOT Analysis now.
Ansoff’s Matrix
Also known as: Product-market growth matrix, Product-market expansion grid or Ansoff’s model.
This chart focuses on analyzing whether it is worth it to grow your current products, services or markets; or whether it would be more profitable to explore new ones. It is a particularly helpful tool when developing new products and marketing expansion strategies.
It consists of a 2x2 matrix which evaluates market penetration, market development, product development, and diversification.
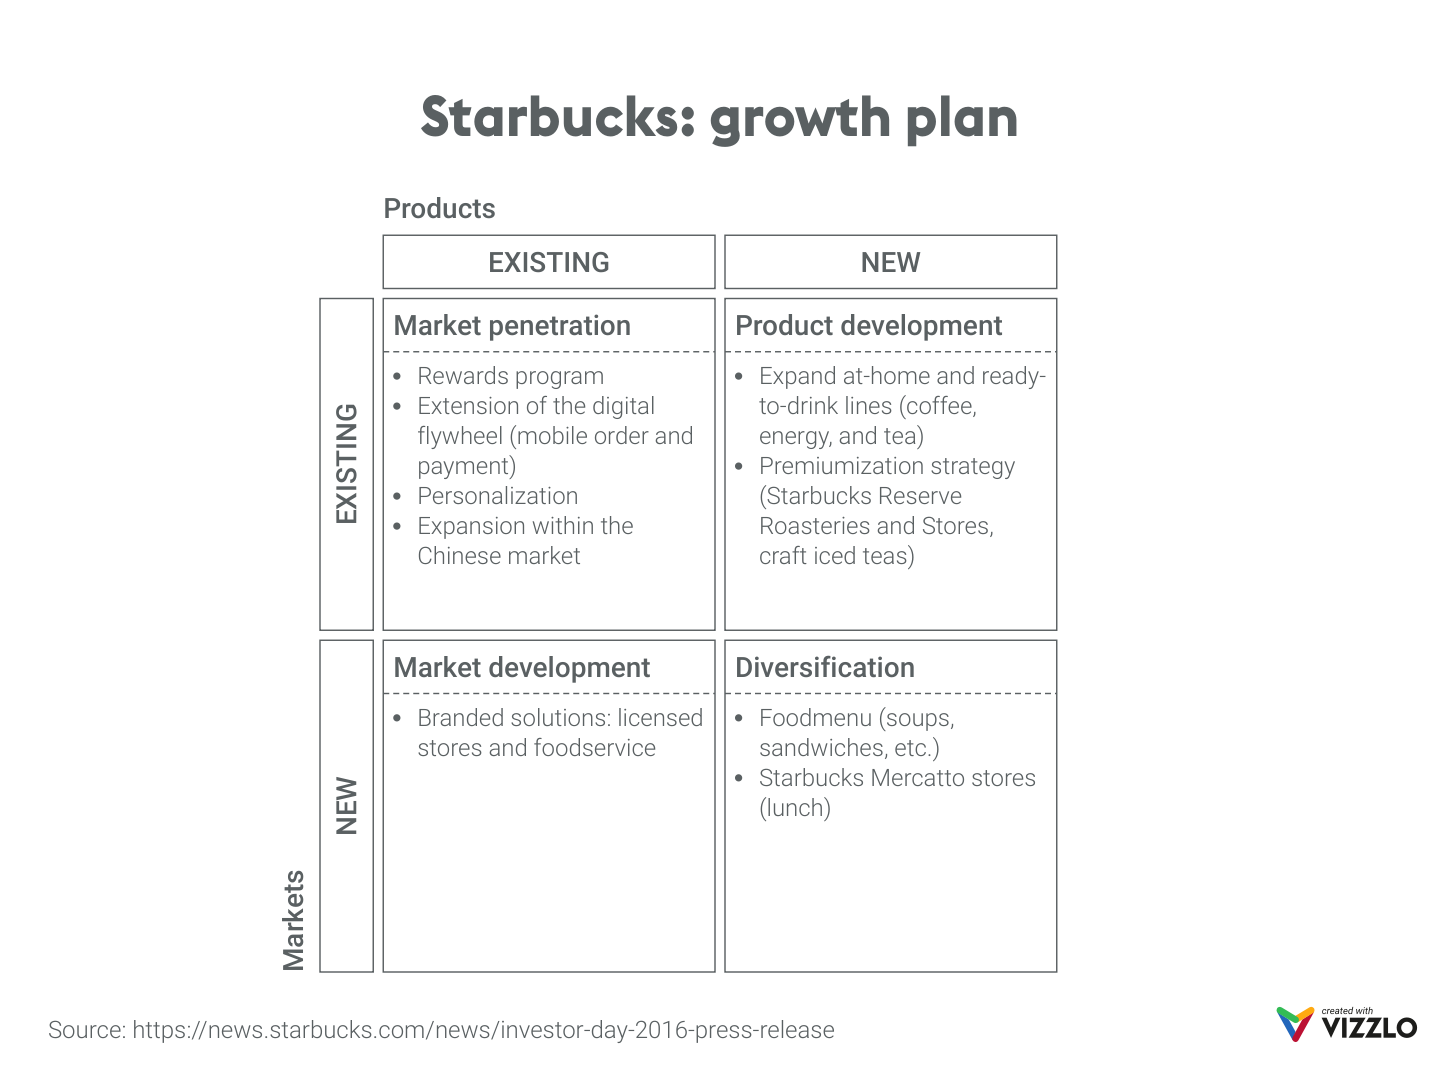
Because of its visual honesty on each quadrant, it is used to make decisions on any diversification strategy, helping better identify opportunities and risks when doing strategic planning.
With this matrix, you can decide if you invest in improving a product, or you increase the market share of your existing version of it. It also leads to decisions such as creating new products in a current market or courageously developing a new product for an unexplored market.
See how to create an Ansoff’s Matrix.
BCG Matrix
Also known as: Growth-share matrix, Product portfolio matrix or Boston Consulting Group analysis.
This chart explores the growth rate and relative market share of business units or products. It assigns priority and should determine where to focus funds in direct relation to the cash generation of your different products or business units.
It showcases the product life cycle theory in a 2x2 matrix, assuming market share is the primary success factor.
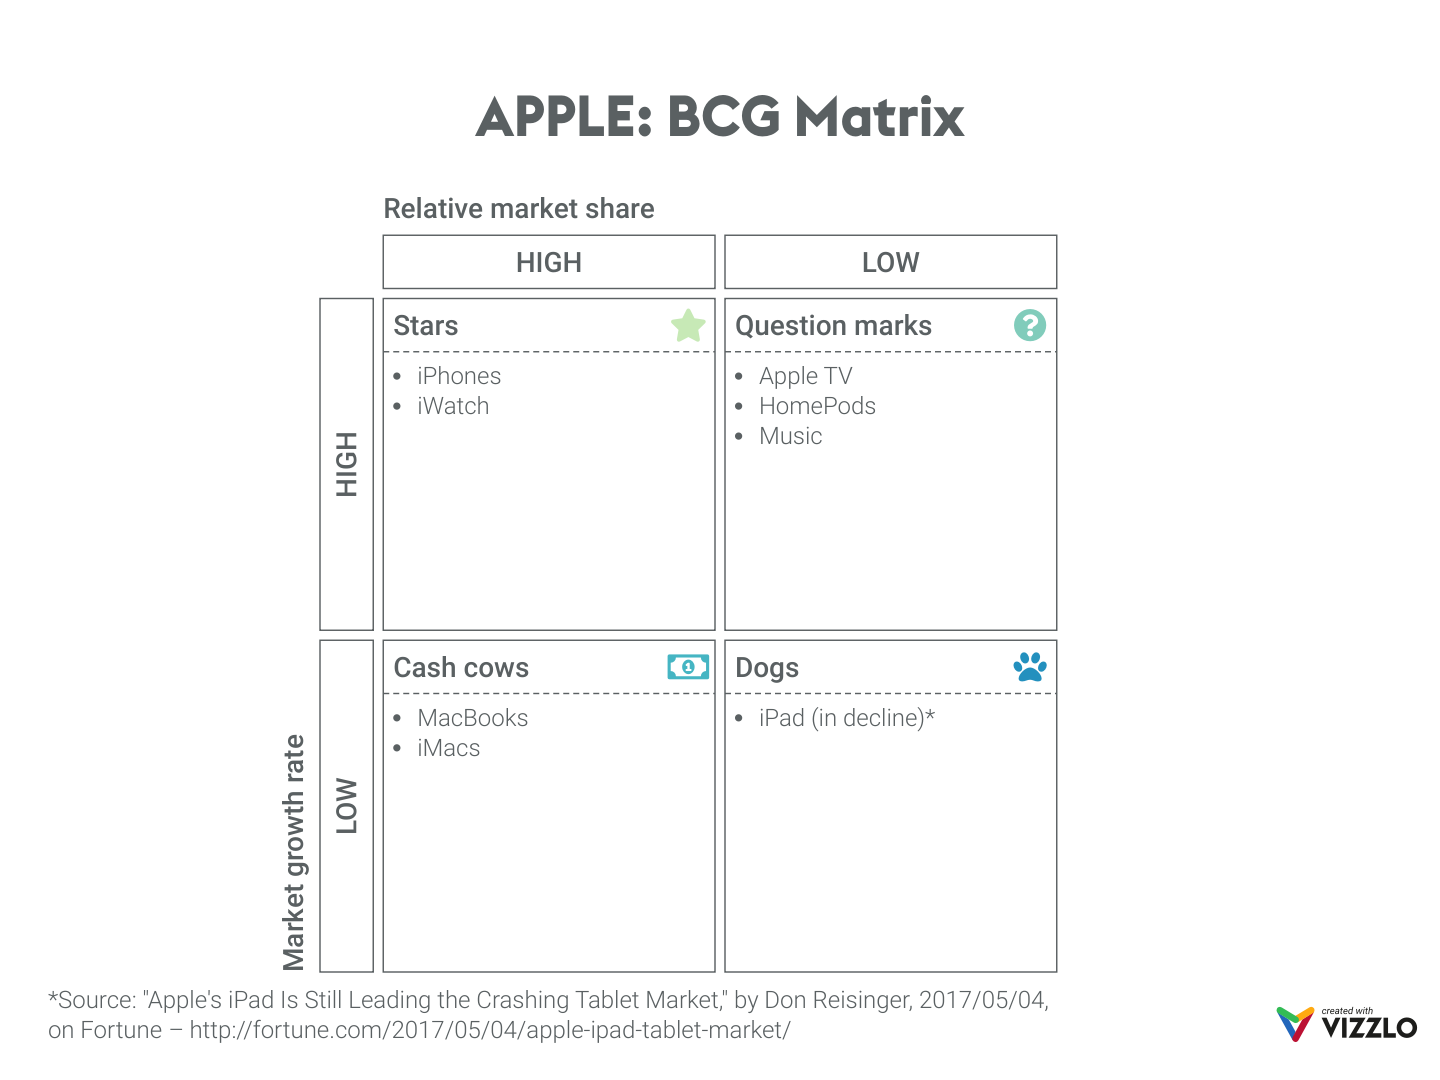
It is ideal for long-term strategic planning, letting you review your portfolio and decide if products should be invested on or discontinued. It also works on strategies you are currently investing on in a specific business unit.
Keep in mind the BCG Matrix assumes that the more money you spend on a product or business unit, the more its market share will grow. You should consider adding other factors to your decision making when ranking an industry’s attractiveness and editing your business strategy.
Make your own BCG Matrix in seconds with Vizzlo.
Let us know how your presentations went! Use #vizzlove and don’t forget to combine strategic planning tools when making your decisions. Also, remember to present your information in an easy-to-read, quick-to-make and designer-grade way: the Vizzlo way!
Is there another chart you like to use in your strategic planning process? We would love to make it for you! Just write a quick message and see your wishes come true. We look forward to your feedback.