Chart Vizzard
Vizzlo's AI-based chart generatorChristmas Ball Chart
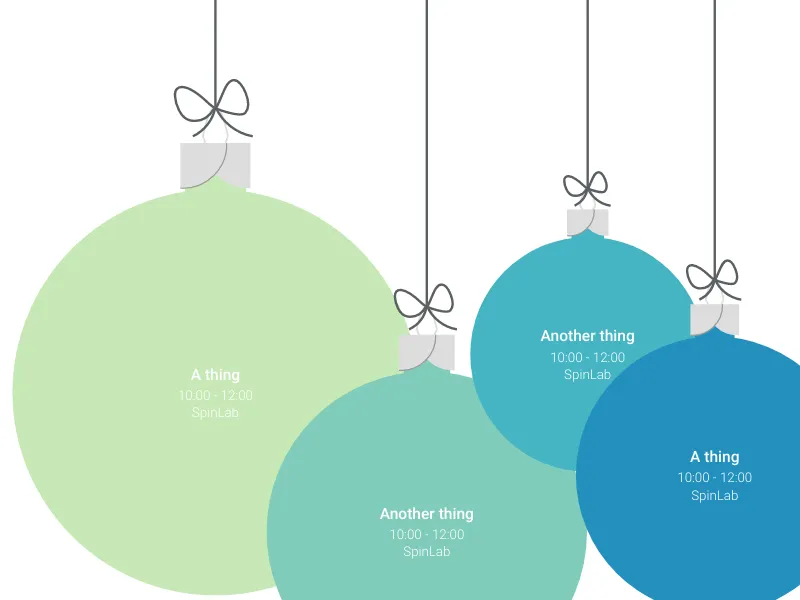
X-MAS SPECIAL! Tell your christmas story with christmas balls.

Features
- Custom colors and sizes
What is a Christmas ball chart?
Vizzlo’s Christmas ball chart is a decorative graphic to list key facts and events with a lot of flexibility.
This chart is perfect to display the agenda of a year-end meeting or presentation, the program of an event, or simply to present ideas and figures. You can also quickly adjust the size of the balls to compare the relative size of your data.
How to make a Christmas ball chart with Vizzlo?
Create this beautiful chart online in seconds and give your presentations a holiday twist:
- Explore the Vizzlo themes (tab “APPEARANCE”) to choose your favorite color palette and font combination. We suggest using our “Christmas” special theme to match your chart with the season.
- Click on the balls to select and edit their details. Drag and drop them to reposition them as you wish.
- Use the active cards in the sidebar to adjust their size and colors.
Christmas Ball Chart: What's new?
Christmas Ball Chart Alternatives
Use Cases
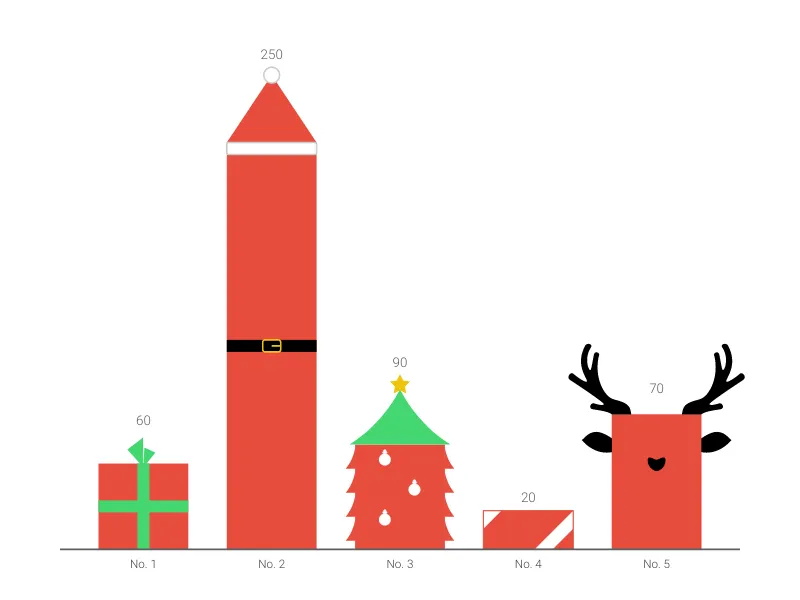
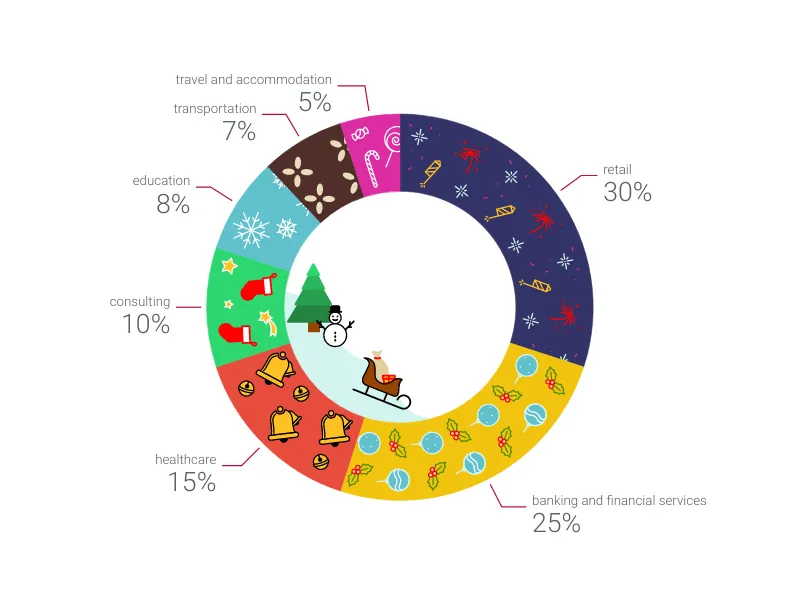
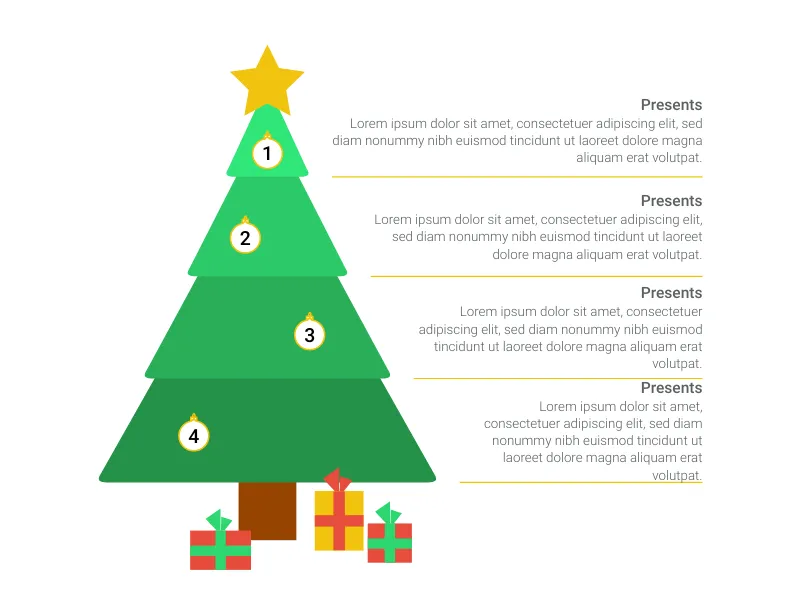
Pictorial chartsEnhance your productivity
Create a Christmas Ball Chart directly in the tools you love

Create a Christmas Ball Chart in PowerPoint with
Vizzlo's add-in
Loved by professionals around the world


Visualizations your audience won’t forget
Convey abstract concepts and data with professionally designed
charts and graphics you can easily edit and customize.


