Chart Vizzard
Vizzlo's AI-based chart generatorChristmas Bar Chart
X-MAS SPECIAL! Give your data a holiday theme with this special bar chart.
What is a Christmas bar chart?
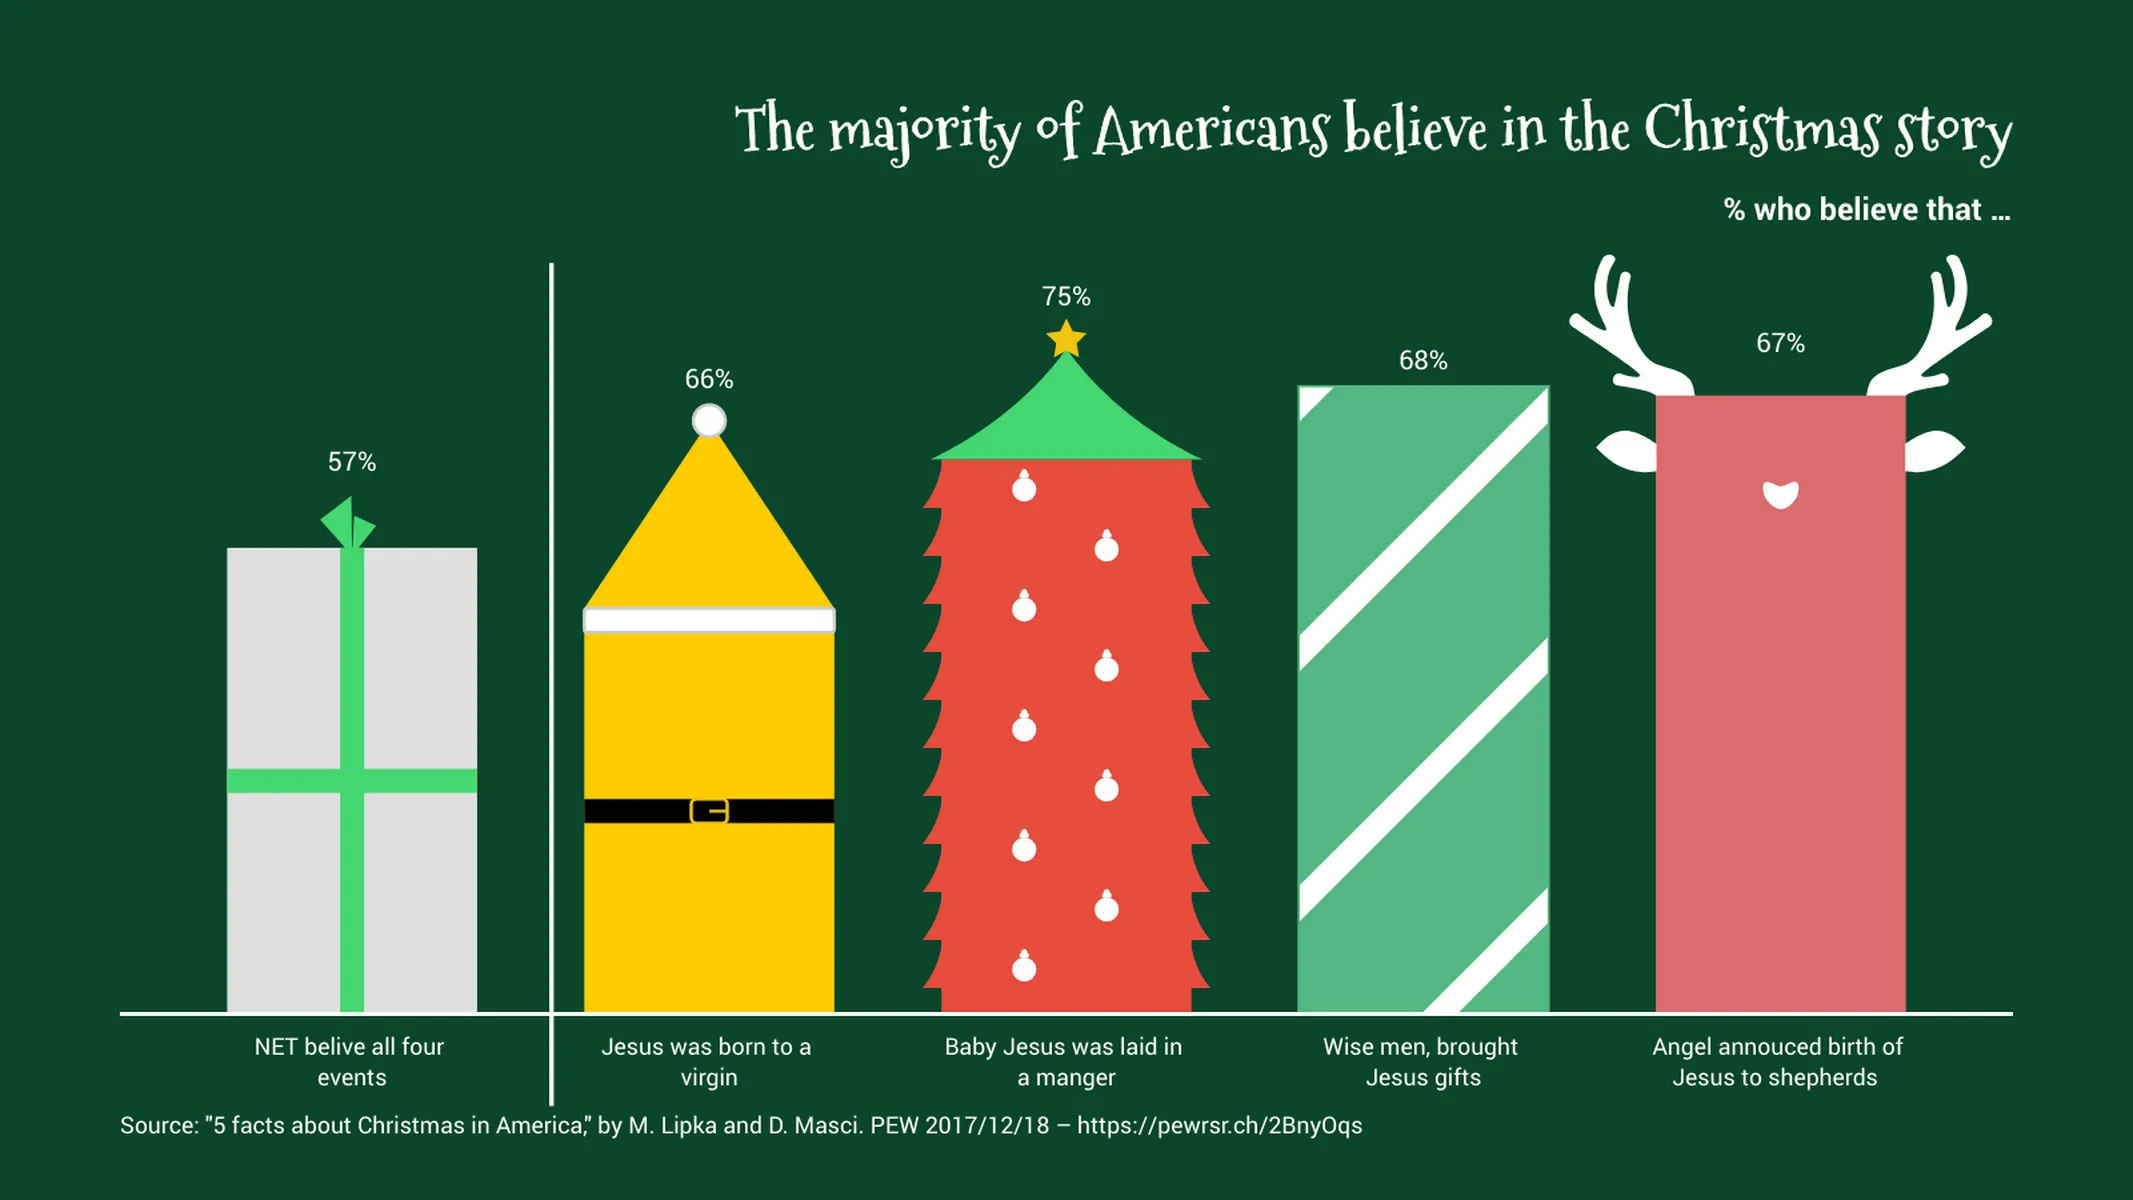
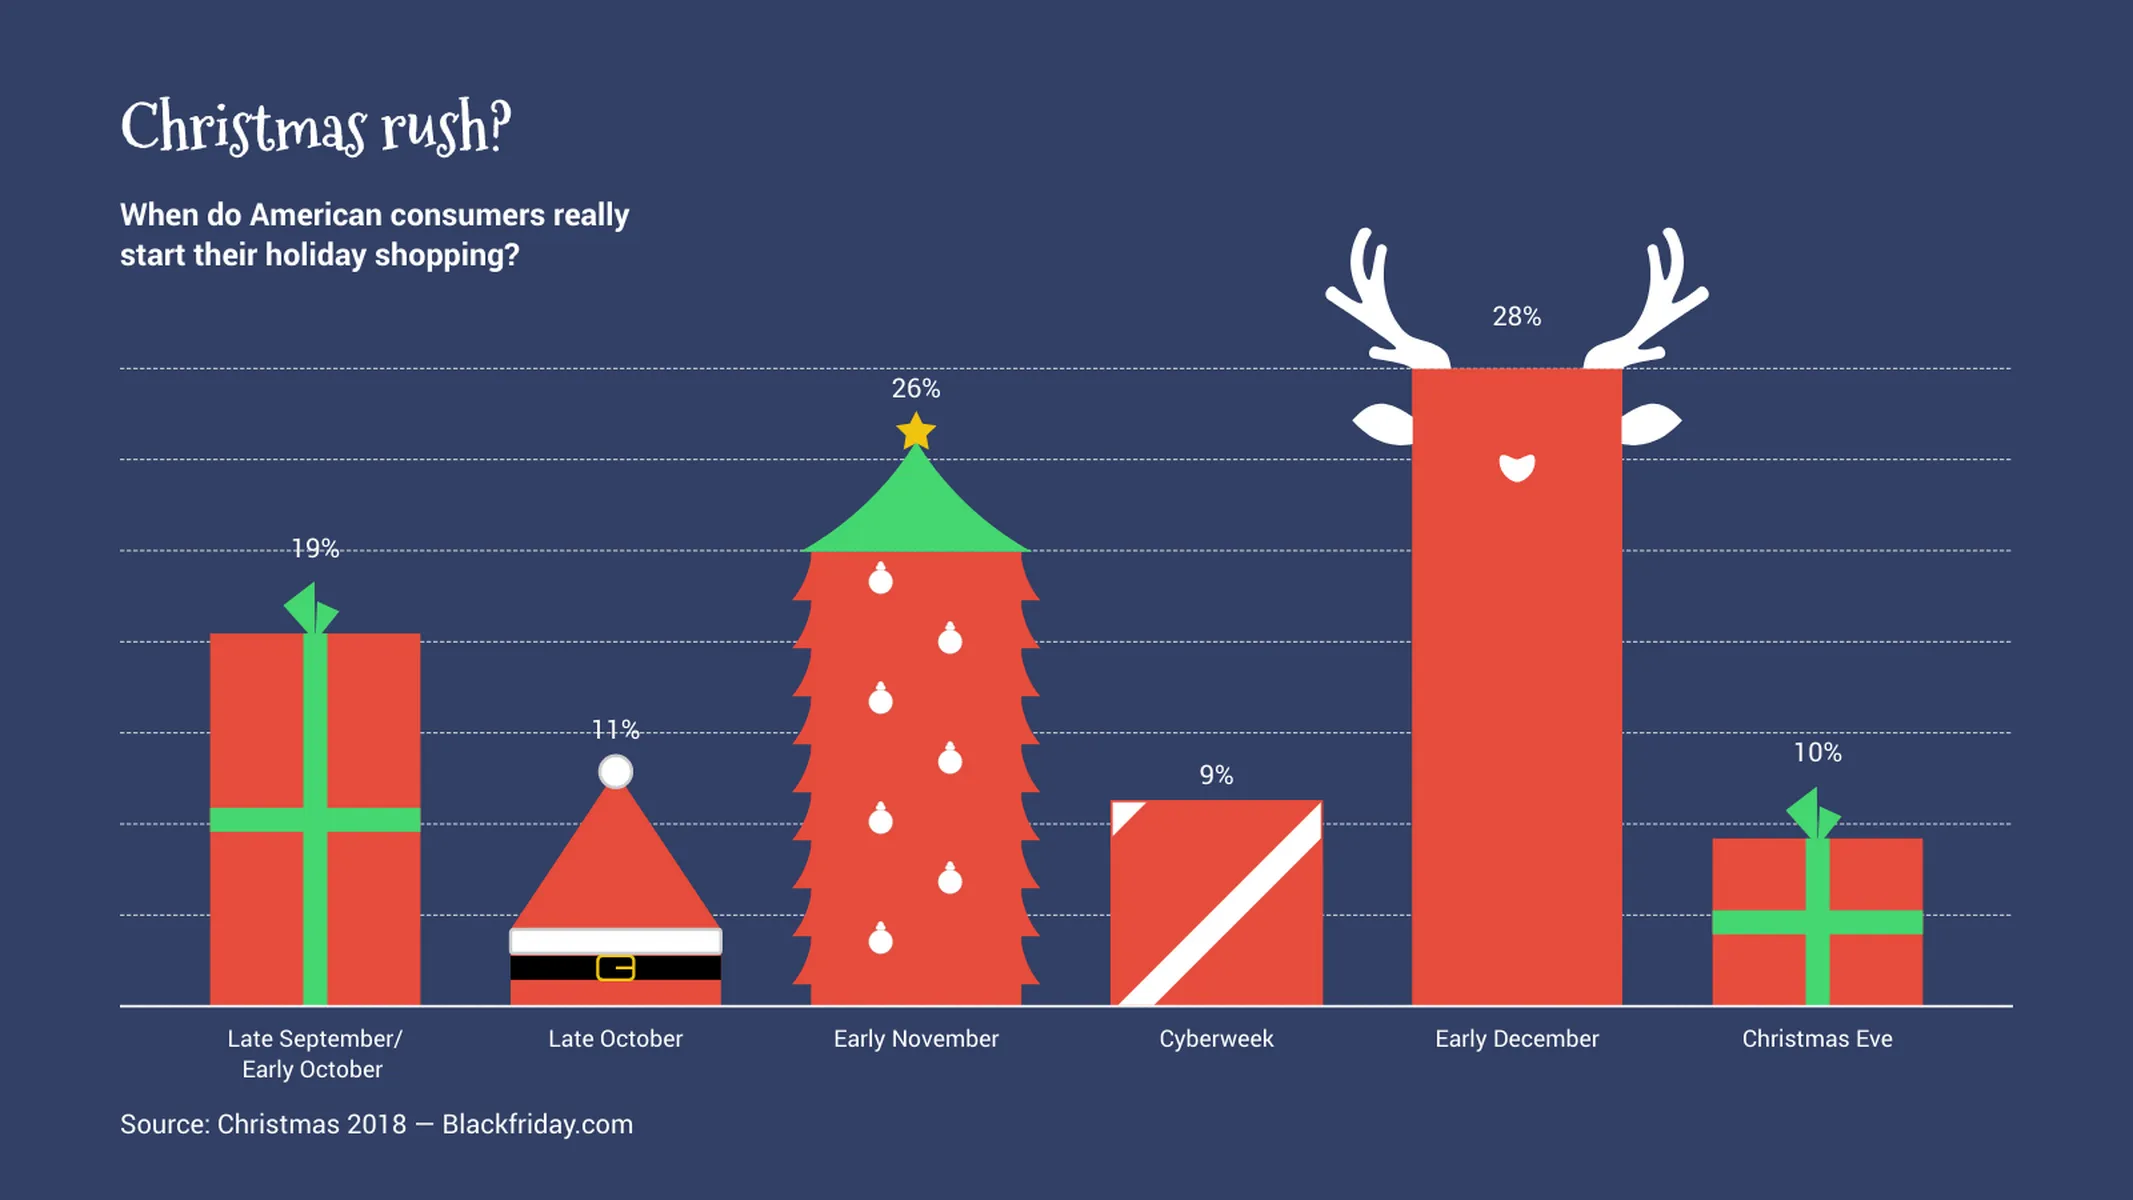
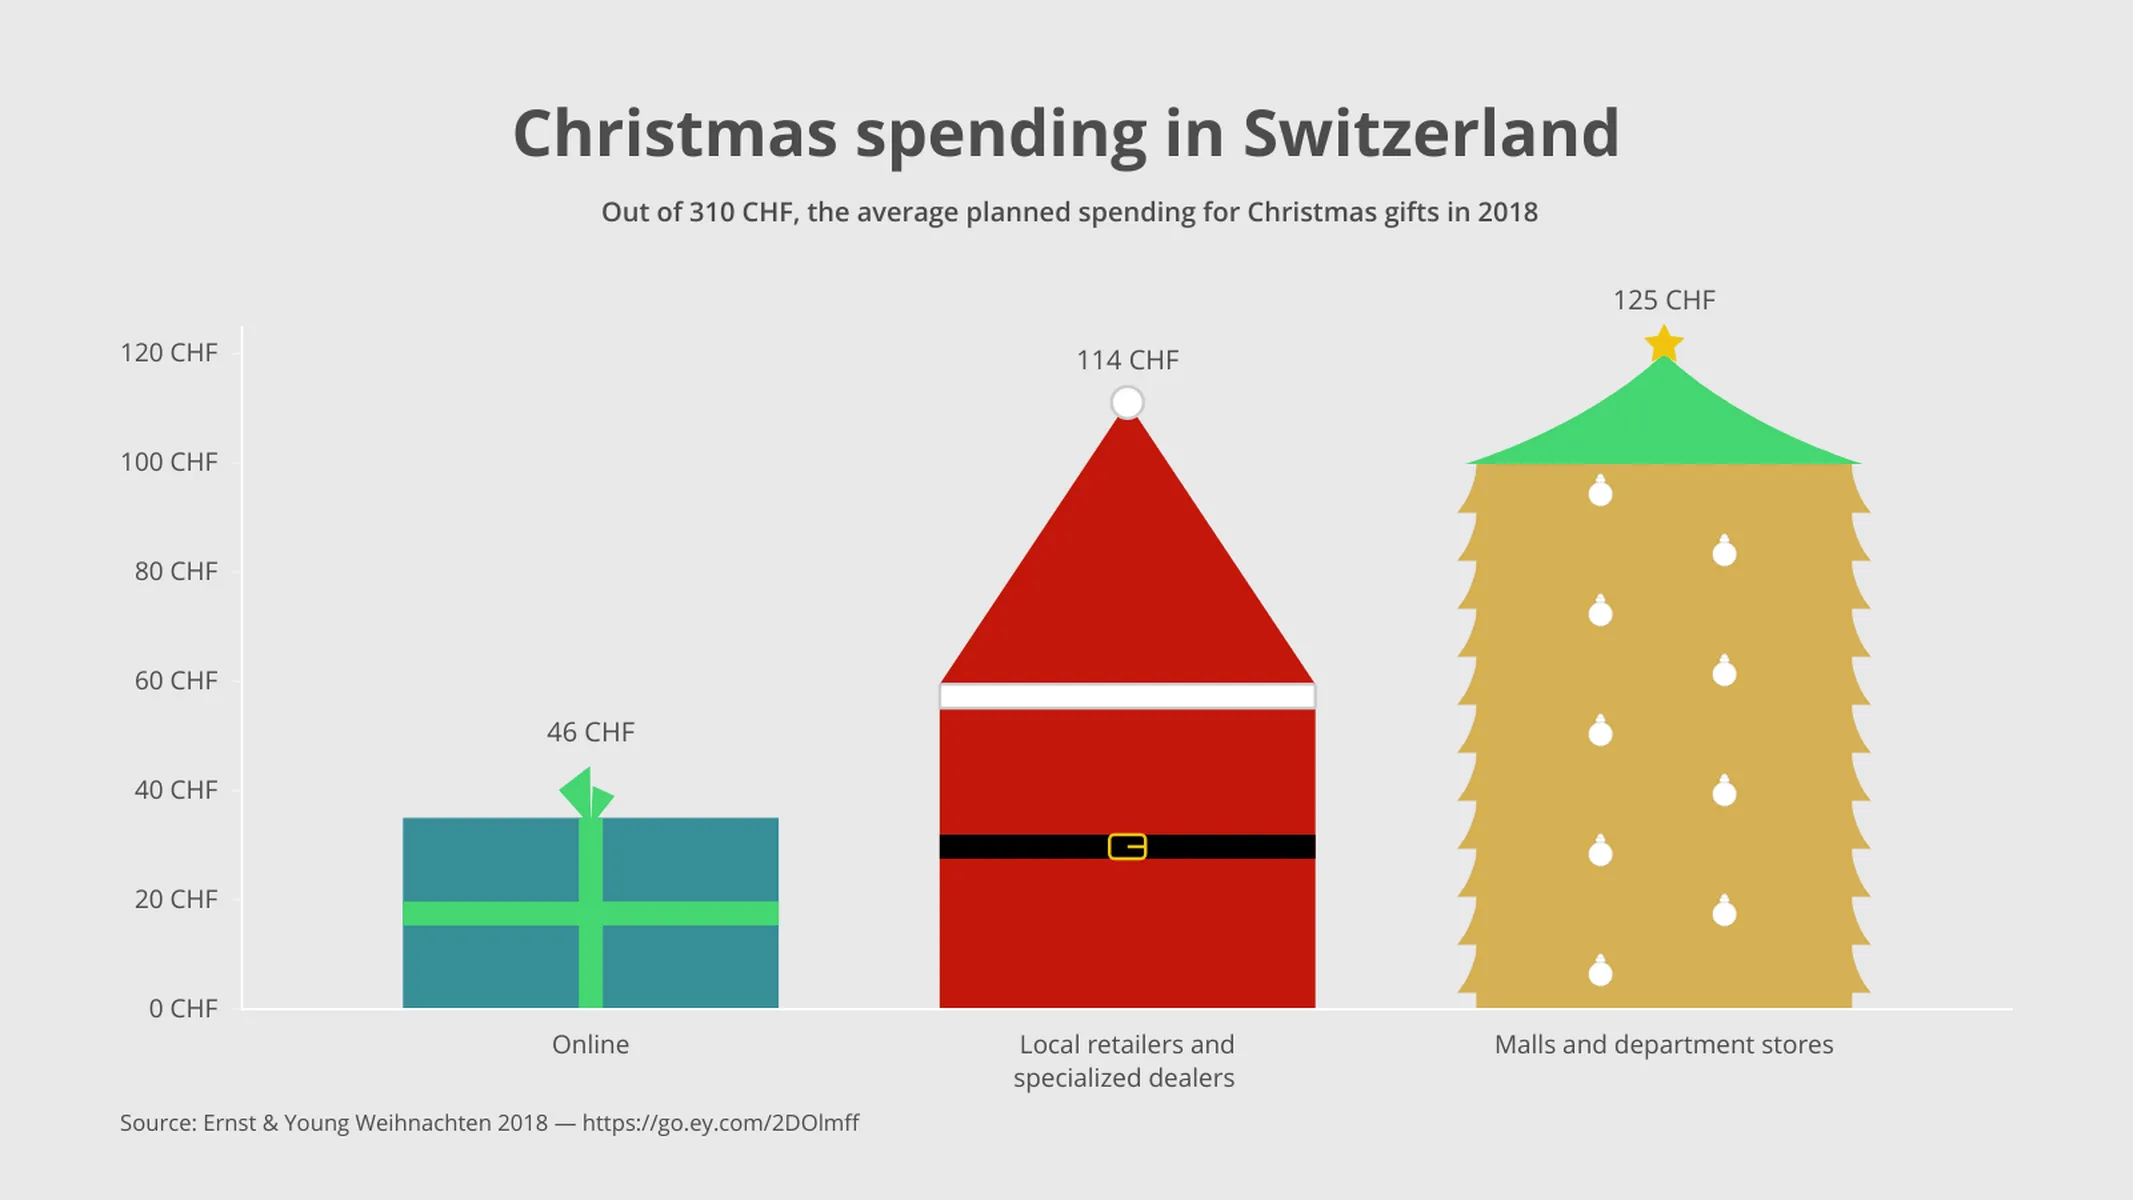
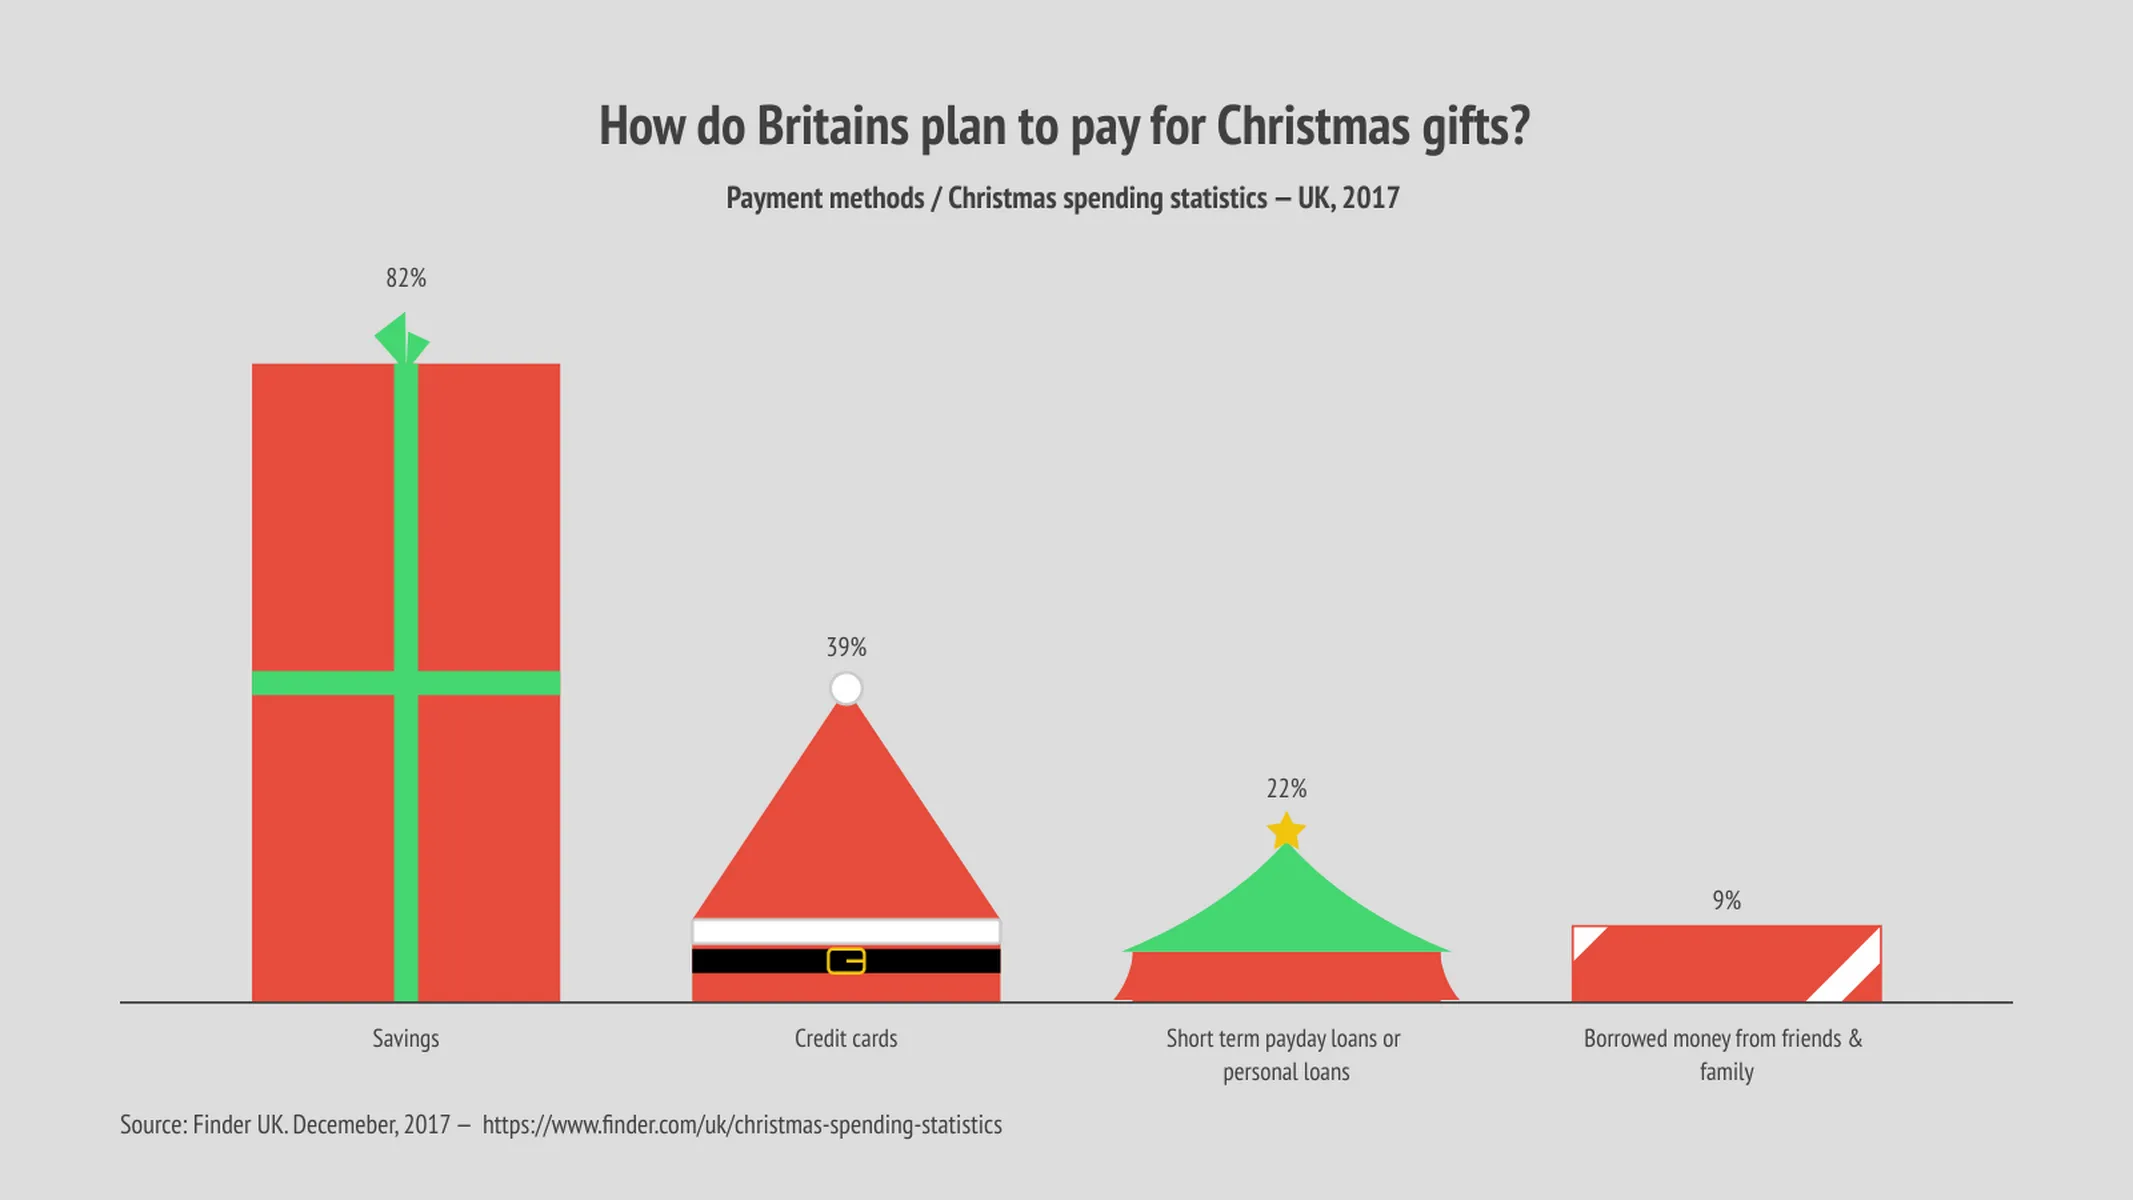
A Christmas bar chart is a festively decorated column graph. The length of the columns is proportional to the values of the data they represent, making different categories easy to compare.
How to make a Christmas bar chart with Vizzlo?
Create this holiday-themed data-driven chart online in seconds and add Christmas magic to your presentations and reports:
- Click on the elements to start editing them.
- You can also use their active cards in the sidebar to edit values, labels and colors.
- Alternatively, import or copy and paste your data using Vizzlo’s spreadsheet (click the button “EDIT DATA IN SPREADSHEET,” on the tab “DATA” of the sidebar).
- Explore the customization options of the tab “APPEARANCE” to customize axes and grids, and refine the look of your chart.
Christmas bar chart: key features
- Custom number formats and colors
- Custom colors
- Custom axes and grid
- Optional labeling of individual values
- Analysis lines: growth rates (CAGR), reference lines, trendlines, and benchmarks
- Optional sorting by value
- Adjustable min/max values for y-axis
- Vertical view only
Christmas Bar Chart: What's new?
Added support for reference lines!
Christmas Bar Chart Alternatives
Enhance your productivity
Create a Christmas Bar Chart directly in the tools you love

Create a Christmas Bar Chart in PowerPoint with
Vizzlo's add-in
Loved by professionals around the world


Visualizations your audience won’t forget
Convey abstract concepts and data with professionally designed
charts and graphics you can easily edit and customize.
