Chart Vizzard
Vizzlo's AI-based chart generatorCreate your Christmas Donut Chart in seconds
X-MAS SPECIAL! Give your data a holiday twist and season your presentation with this special donut chart.
Create your chart in 3 simple steps
- Create new Christmas Donut Chart
- Add your data
- Export or share
Why Vizzlo?
- Create professional charts in seconds
- Fully customizable, no design skills needed
- Create directly in PowerPoint & Google Slides
What is a Christmas donut chart?
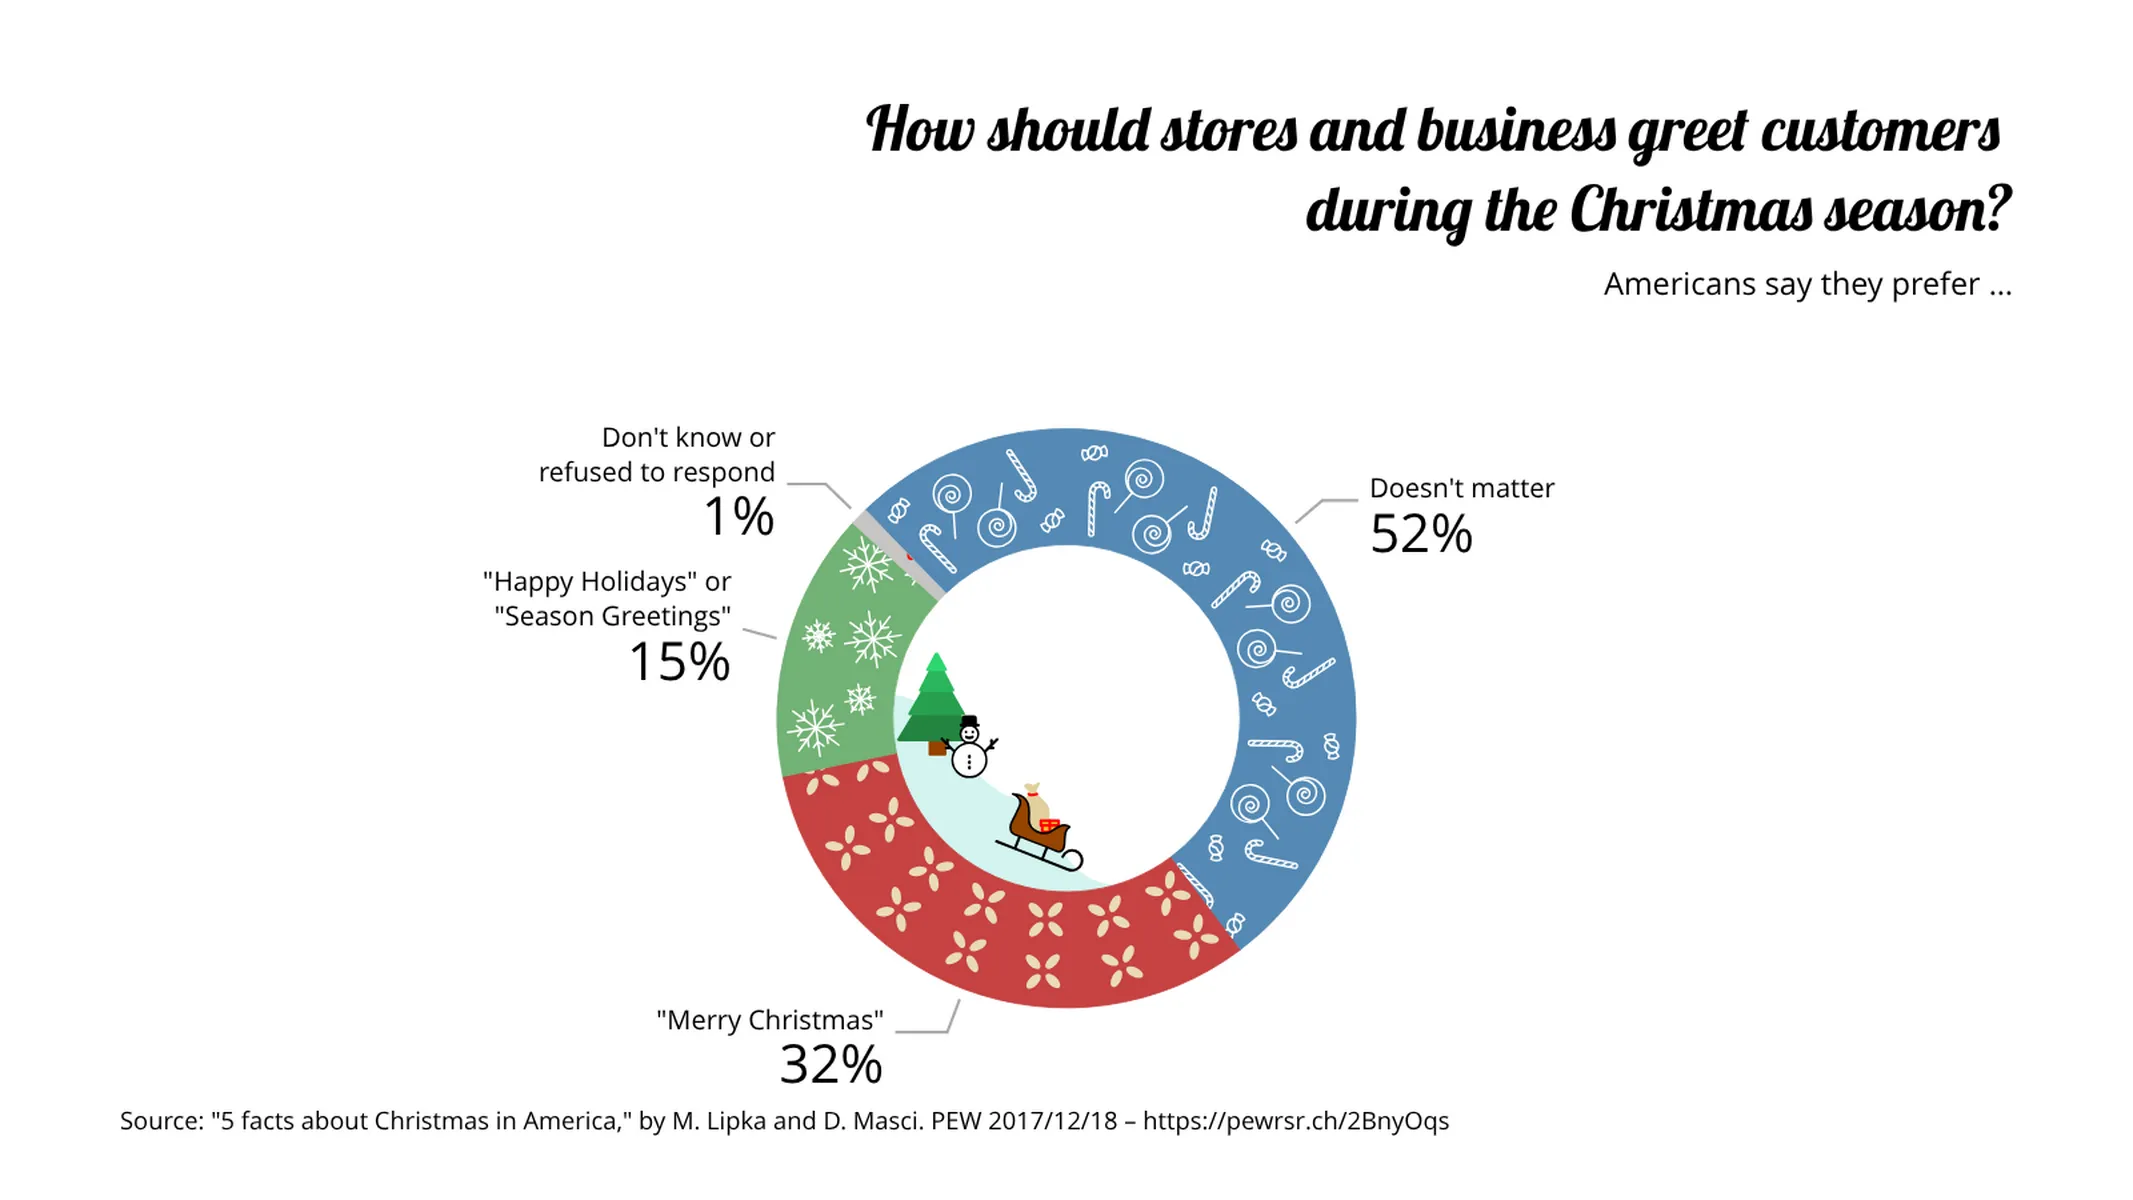
A Christmas donut chart is a festively decorated circular graph. It works precisely like the traditional donut chart: its total area corresponds to 100% and its slices display the values of different categories proportionally, showing their part-to-whole relationship.
Delicious yet very instructive and easy to understand, it is the most original way to convey your message this holiday season!
How to make a Christmas donut chart with Vizzlo?
Create this seasoned data-driven chart online in seconds and make your end-of-year presentations sweeter:
- Click on the elements to directly edit them. You can also use the active cards in the sidebar to enter their values, labels and explode (highlight) a slice.
- Click on the “plus” button to add new categories.
- Alternatively, to add your data quickly, copy and paste it into Vizzlo’s spreadsheet (click on the button “EDIT DATA IN SPREADSHEET,” on the tab “DATA” of the sidebar).
- Explore the customization options of the tab “APPEARANCE” to customize the display of connectors and labels and refine the look of your chart.
Christmas donut chart maker: key features
- Custom colors number formats
- Custom connectors and labels
- Exploded segments
- Optional sorting by value
- Adjustable start angle
Christmas Donut Chart: What's new?
Christmas Donut Chart Alternatives
Enhance your productivity
Create a Christmas Donut Chart directly in the tools you love

Create a Christmas Donut Chart in PowerPoint with
Vizzlo's add-in

Loved by professionals around the world


Visualizations your audience won’t forget
Convey abstract concepts and data with professionally designed
charts and graphics you can easily edit and customize.