Chart Vizzard
Vizzlo's AI-based chart generatorDart Chart
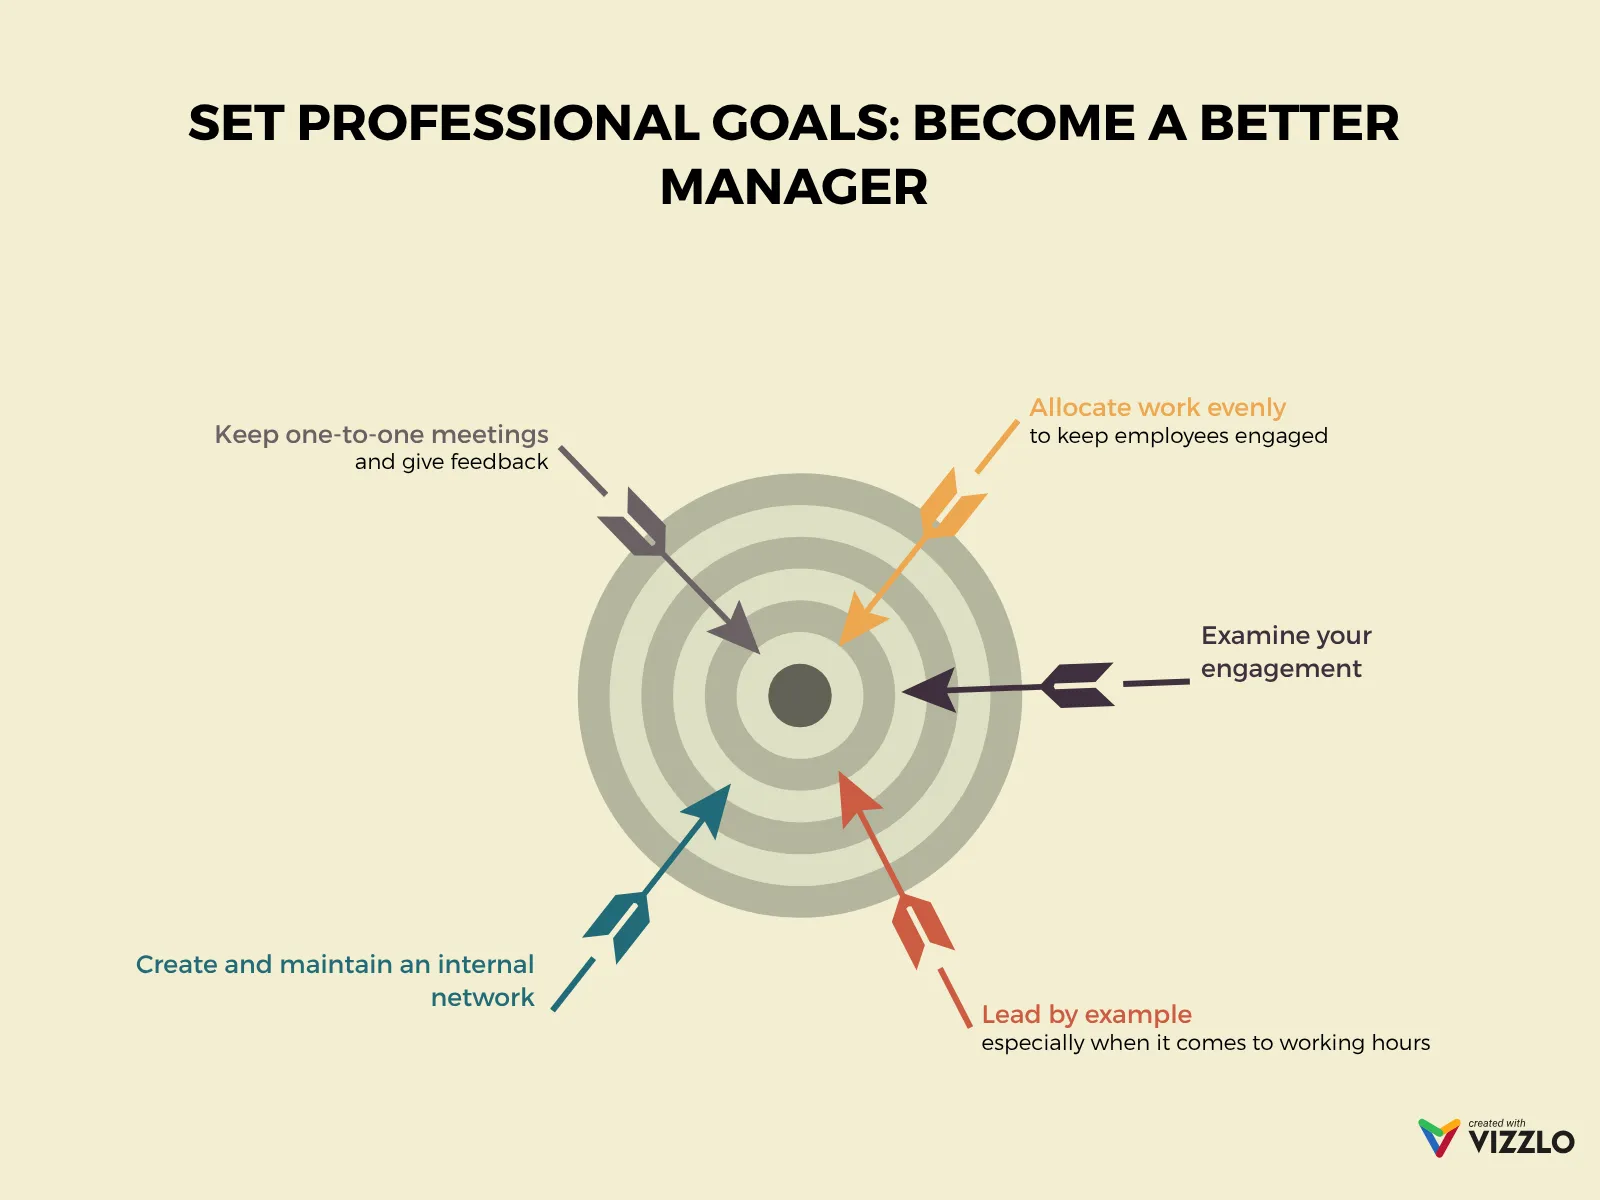
Visualize your competitions' or projects' progress with arrows on a dartboard.
What is a dart chart?
The Dart Chart provides a unique and engaging way to visualize competitive progress or project achievements using a dartboard metaphor. This interactive visualization places customizable arrows on a circular dartboard, making it perfect for displaying how different initiatives, competitors, or projects are performing relative to their targets.
Key Features
- Dartboard visualization: Classic dartboard design with scoring rings and target zones
- Positioned arrows: Each data point appears as an arrow positioned precisely on the board
- Dual labeling: Support for both title and subtitle text for each dart
- Interactive positioning: Drag and drop arrows to adjust their positions on the dartboard
- Competitive context: Perfect metaphor for showing accuracy, achievement, or proximity to goals
Best Use Cases
- Competition tracking: Show how different competitors are performing against targets
- Project milestones: Visualize how close various projects are to hitting their goals
- Performance assessment: Display team or individual achievement levels
- Market positioning: Show where products or services land relative to market expectations
- Goal achievement: Track progress toward objectives using the bullseye metaphor
- Risk assessment: Position initiatives based on risk vs. reward proximity
Configuration Options
The dart chart is designed for maximum visual impact with minimal configuration:
- Arrow positioning: Each dart can be precisely positioned anywhere on the dartboard
- Title and subtitle: Dual text labels provide context for each data point
- Interactive placement: Users can drag arrows to new positions during editing
The dartboard provides natural zones that can represent different performance levels, with the bullseye representing optimal achievement and outer rings showing varying degrees of success or areas for improvement.
This visualization is particularly effective for presentations where you want to add visual interest while maintaining clear data communication about competitive positioning or achievement levels.
Dart Chart: What's new?
Now supports custom document sizes and custom text style formatting.
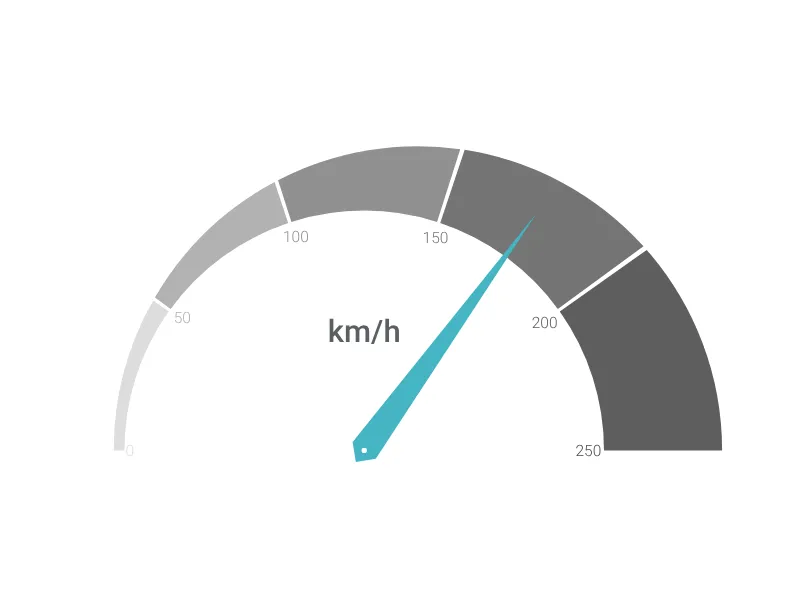
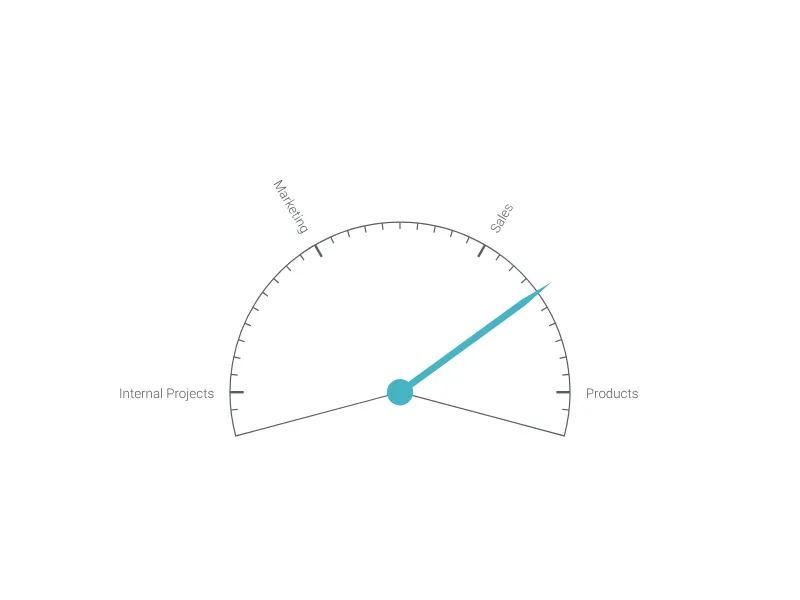
Dart Chart Alternatives
Enhance your productivity
Create a Dart Chart directly in the tools you love

Create a Dart Chart in PowerPoint with
Vizzlo's add-in

Loved by professionals around the world


Visualizations your audience won’t forget
Convey abstract concepts and data with professionally designed
charts and graphics you can easily edit and customize.