Chart Vizzard
Vizzlo's AI-based chart generatorCreate your Radial Percentage in seconds
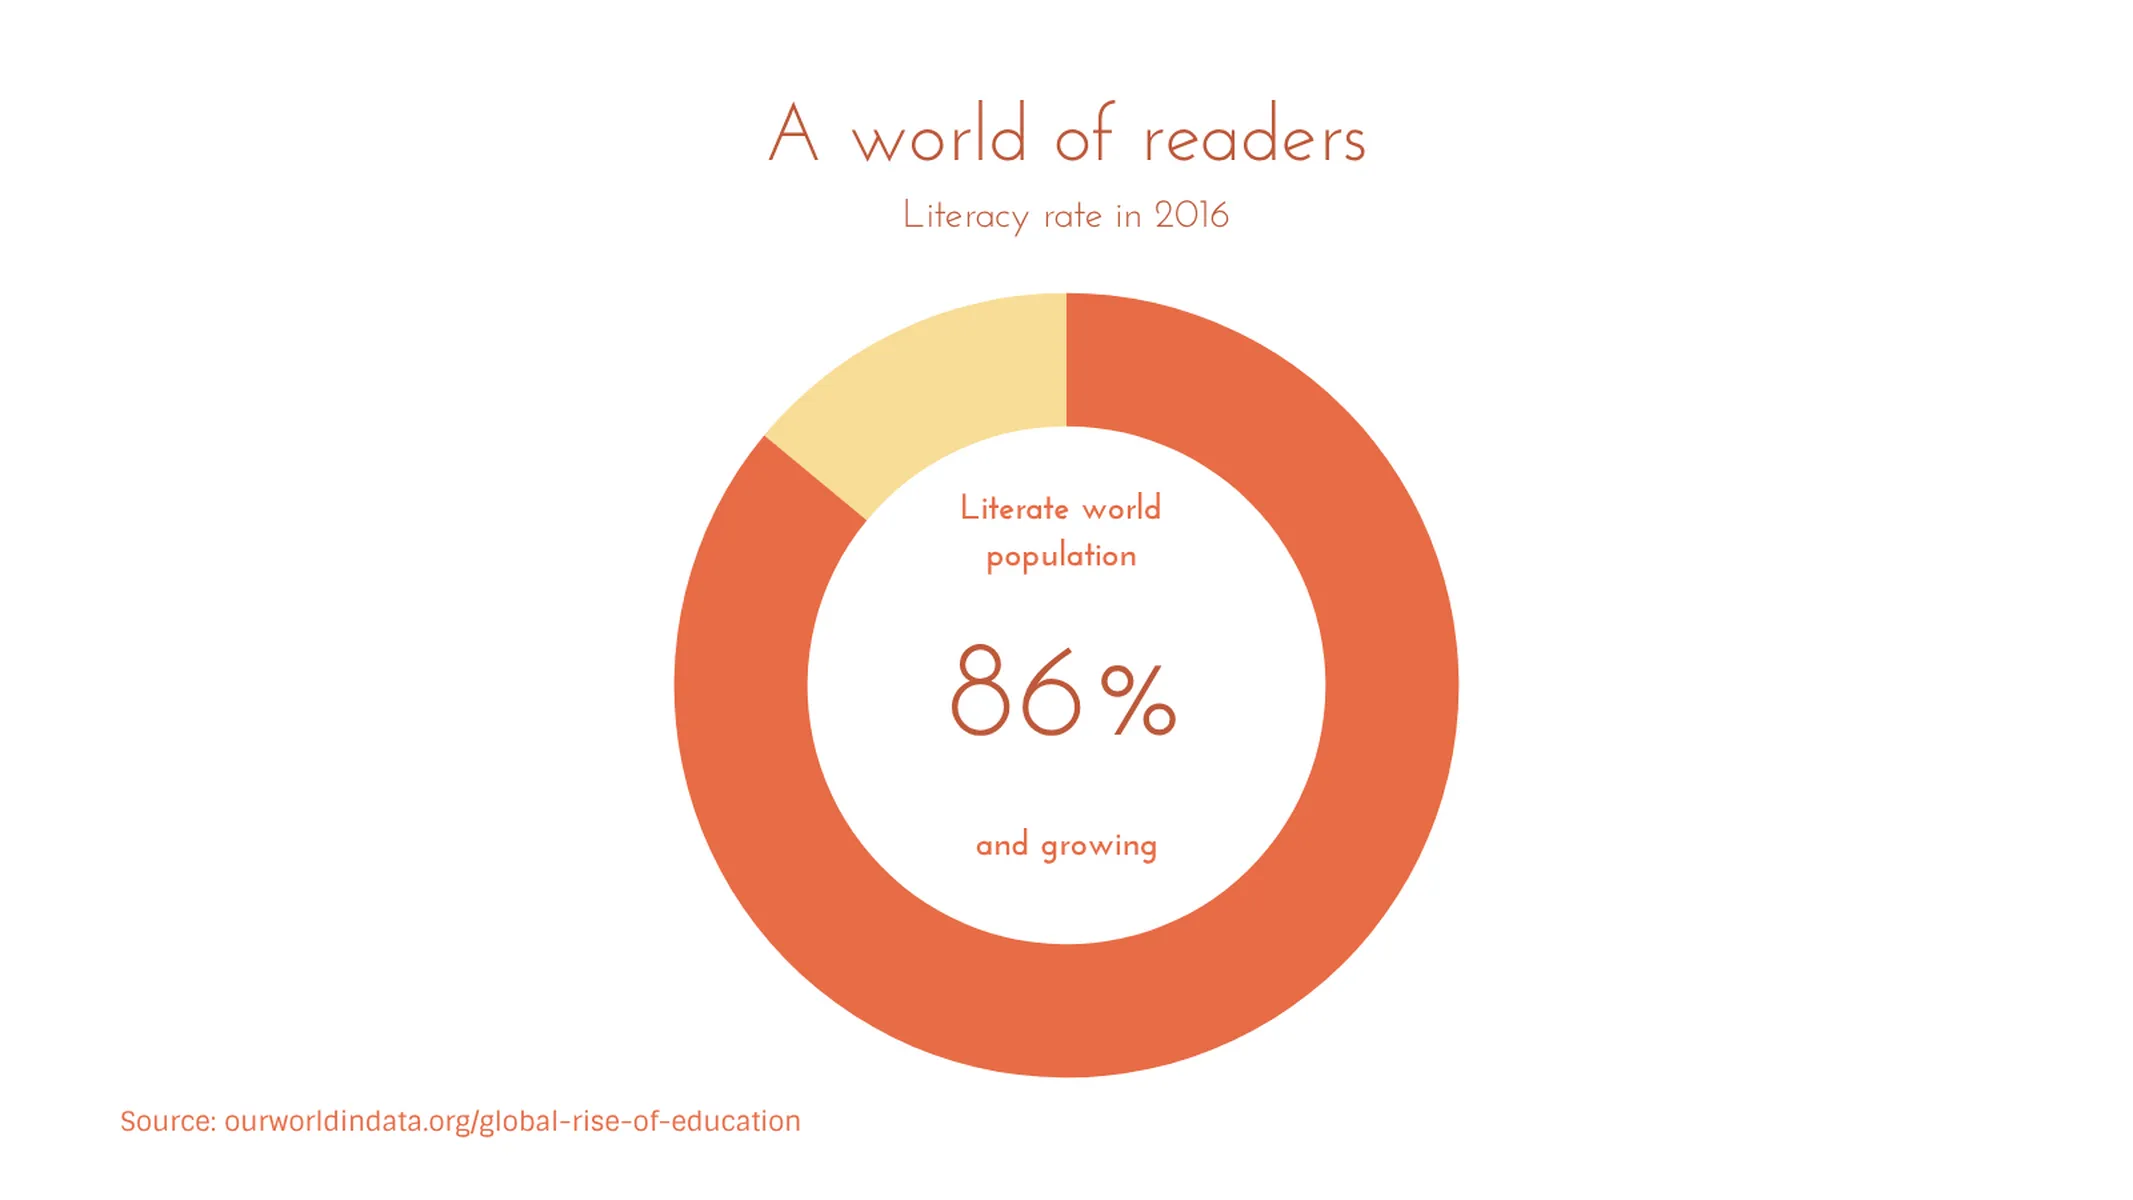
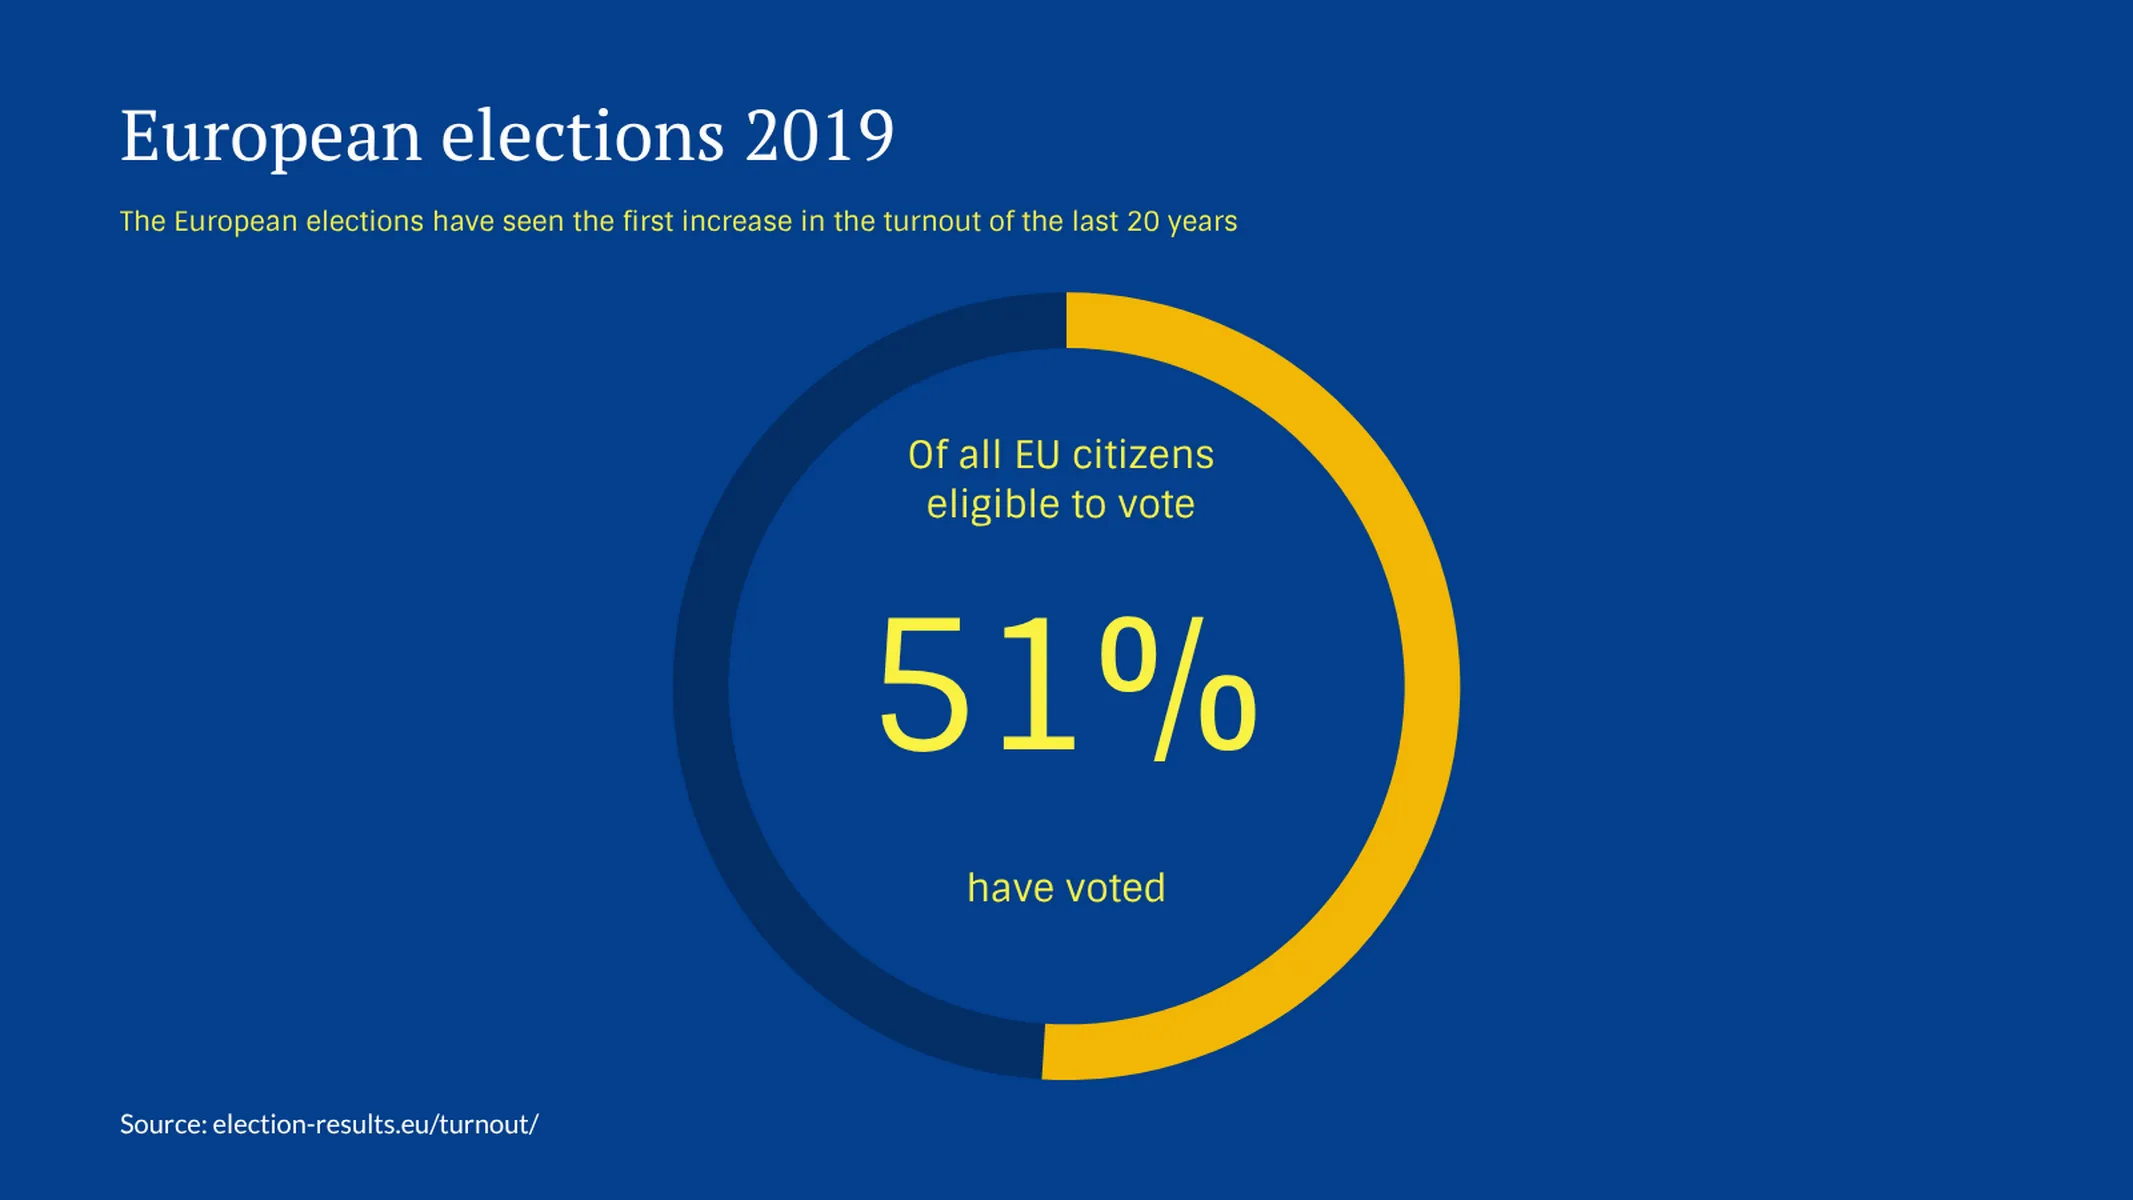
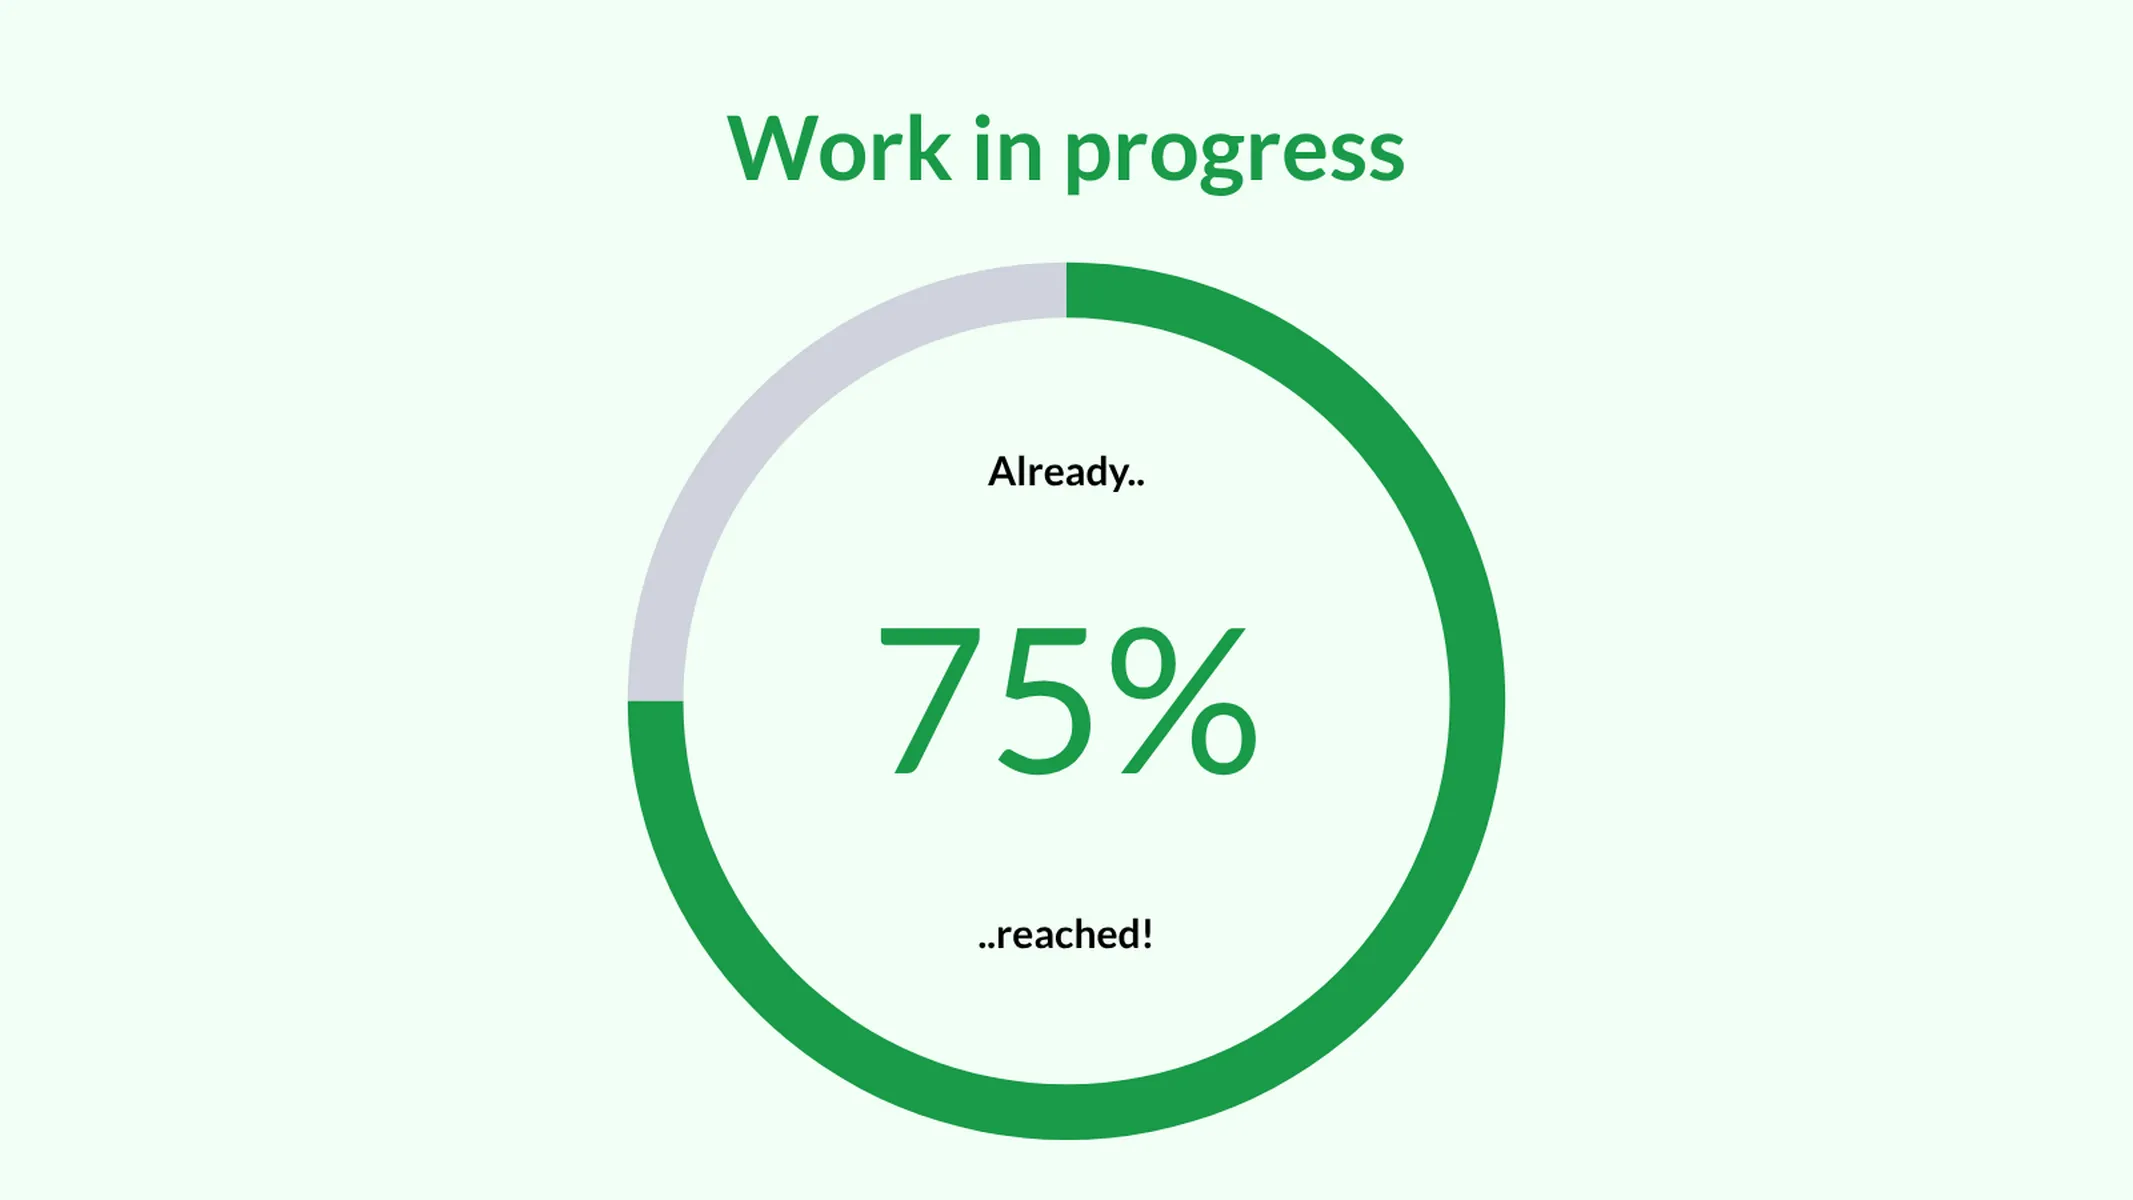
Visualize your progress towards a goal or the share of a whole with this simple but effective chart.

Create your chart in 3 simple steps
- Create new Radial Percentage
- Add your data
- Export or share
Why Vizzlo?
- Create professional charts in seconds
- Fully customizable, no design skills needed
- Create directly in PowerPoint & Google Slides
What is a radial percentage chart?
How close are we to achieving our goal? A radial percentage chart is Vizzlo’s alternative to a circular progress chart. Use a single numeric input to track the development of your project, or to indicate a part of a whole. This variation of a circular bar chart also lends itself very well to visualizing market shares of companies.
How to create a radial percentage chart with Vizzlo?
Create your chart in seconds and inspire your audience with a colorful radial bar chart! Follow these easy steps:
- Click on the segments to edit them
- Use their active card in the sidebar to enter the text and edit colors
- Explore the customization options using the tab “APPEARANCE” in the sidebar and choose your favorite theme or customize a new one
Radial percentage maker: key features
- Custom colors and fonts
- Custom text labels
Radial Percentage: What's new?
Fix importing data in some cases.
Adding a prefix to the center label is now possible.
We have added support for formatting the number in centered label. Now can be more precise than ever.
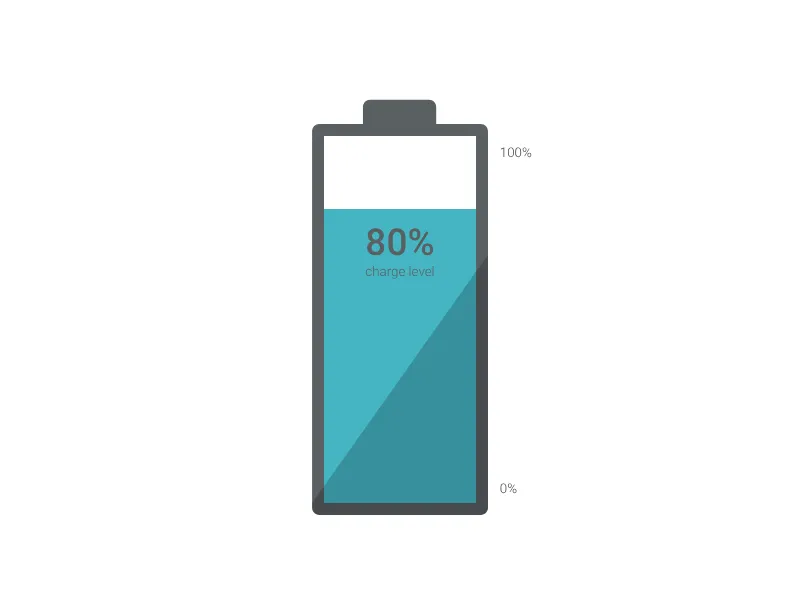
Radial Percentage Alternatives
Enhance your productivity
Create a Radial Percentage directly in the tools you love

Create a Radial Percentage in PowerPoint with
Vizzlo's add-in

Loved by professionals around the world


Visualizations your audience won’t forget
Convey abstract concepts and data with professionally designed
charts and graphics you can easily edit and customize.