Graphs
Battery Chart
Create your Battery Chart in seconds


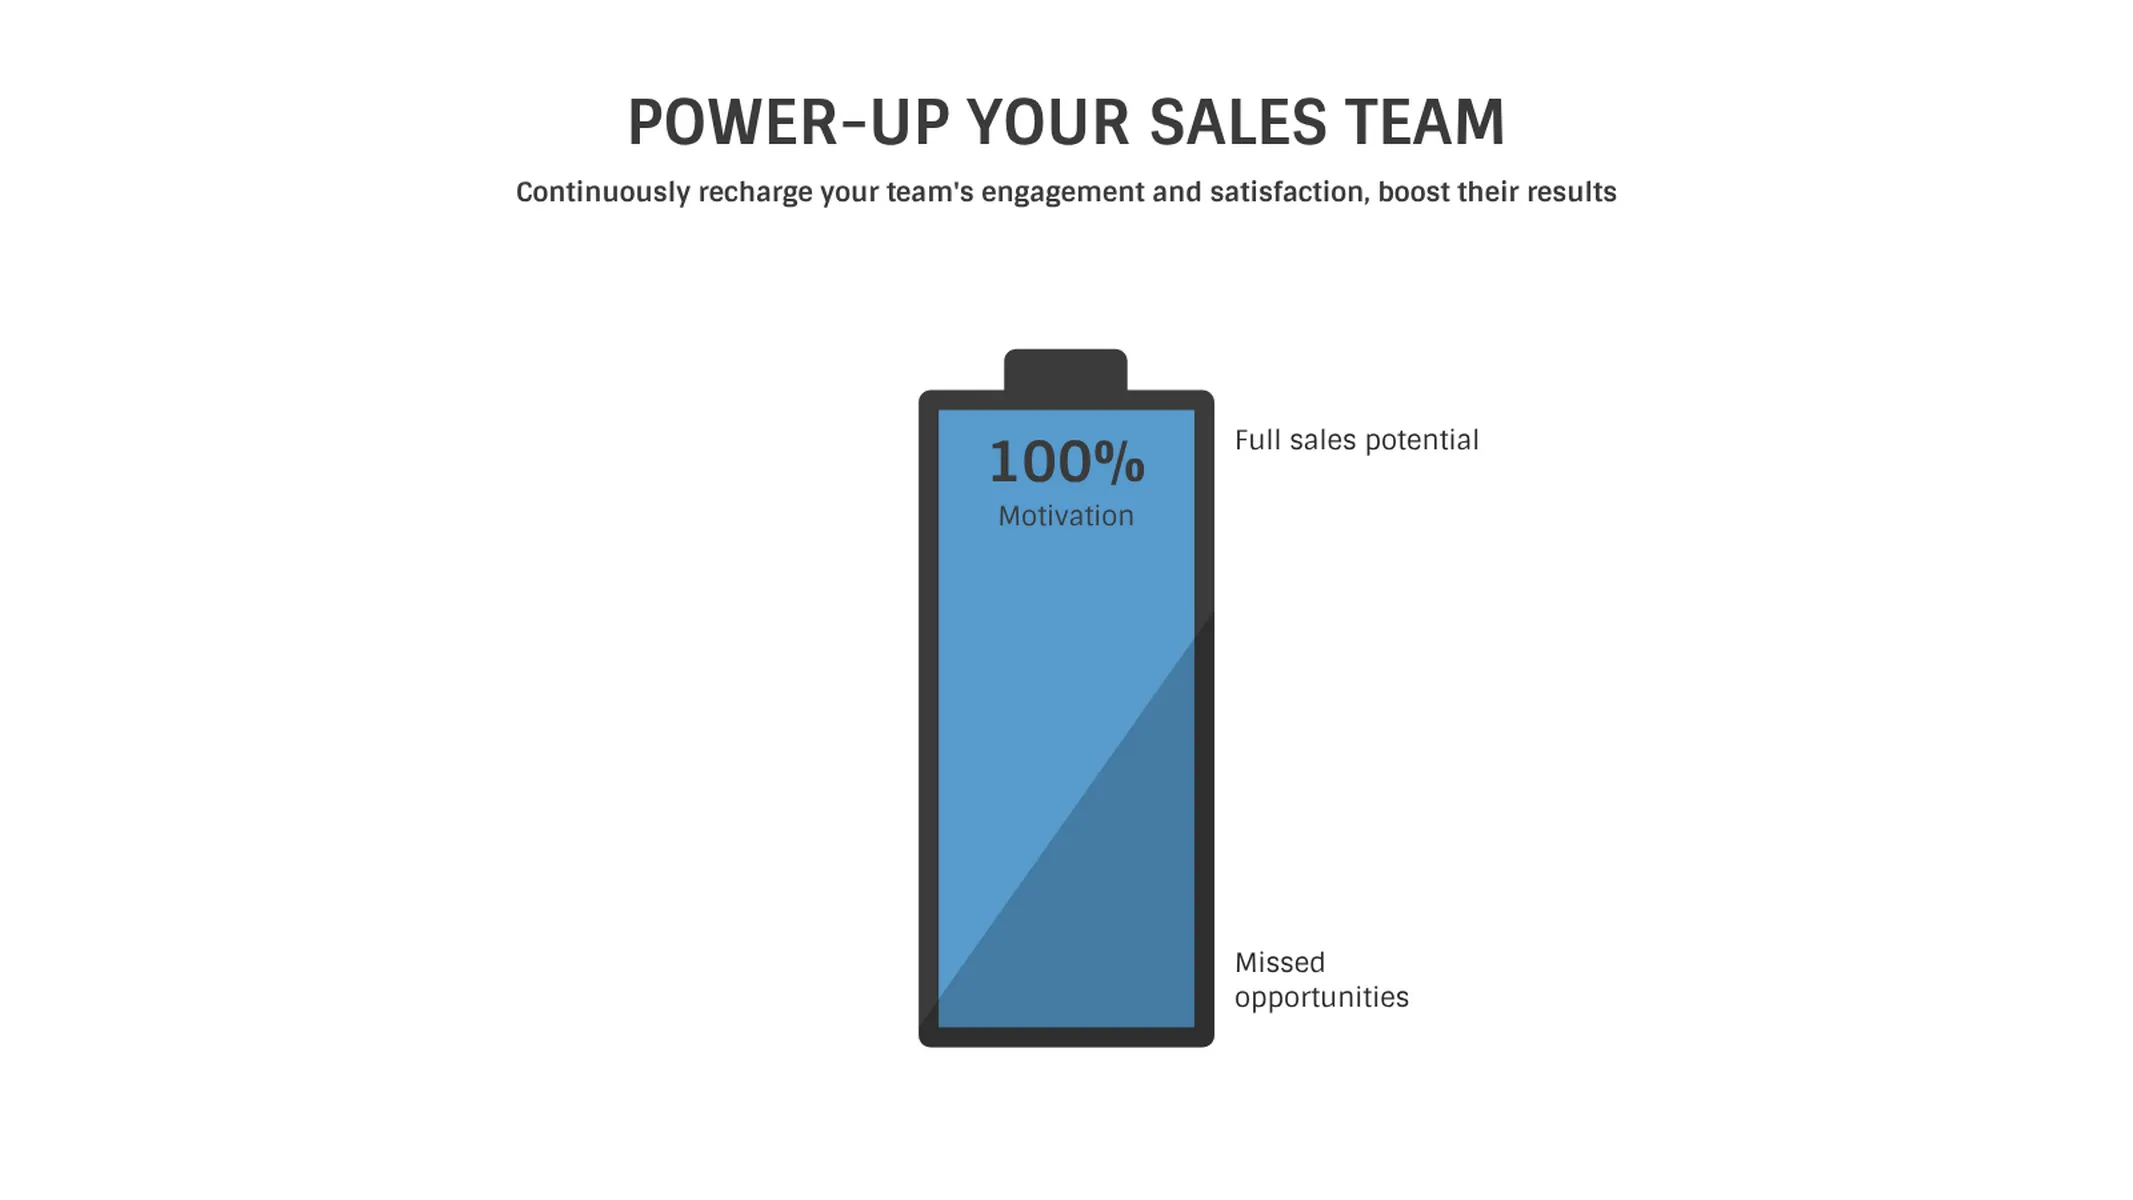
This diagram will be the best choice for representing your business processes.
Create your chart in 3 simple steps
- Create new Battery Chart
- Add your data
- Export or share
Why Vizzlo?
- Create professional charts in seconds
- Fully customizable, no design skills needed
- Create directly in PowerPoint & Google Slides
What is a battery chart?
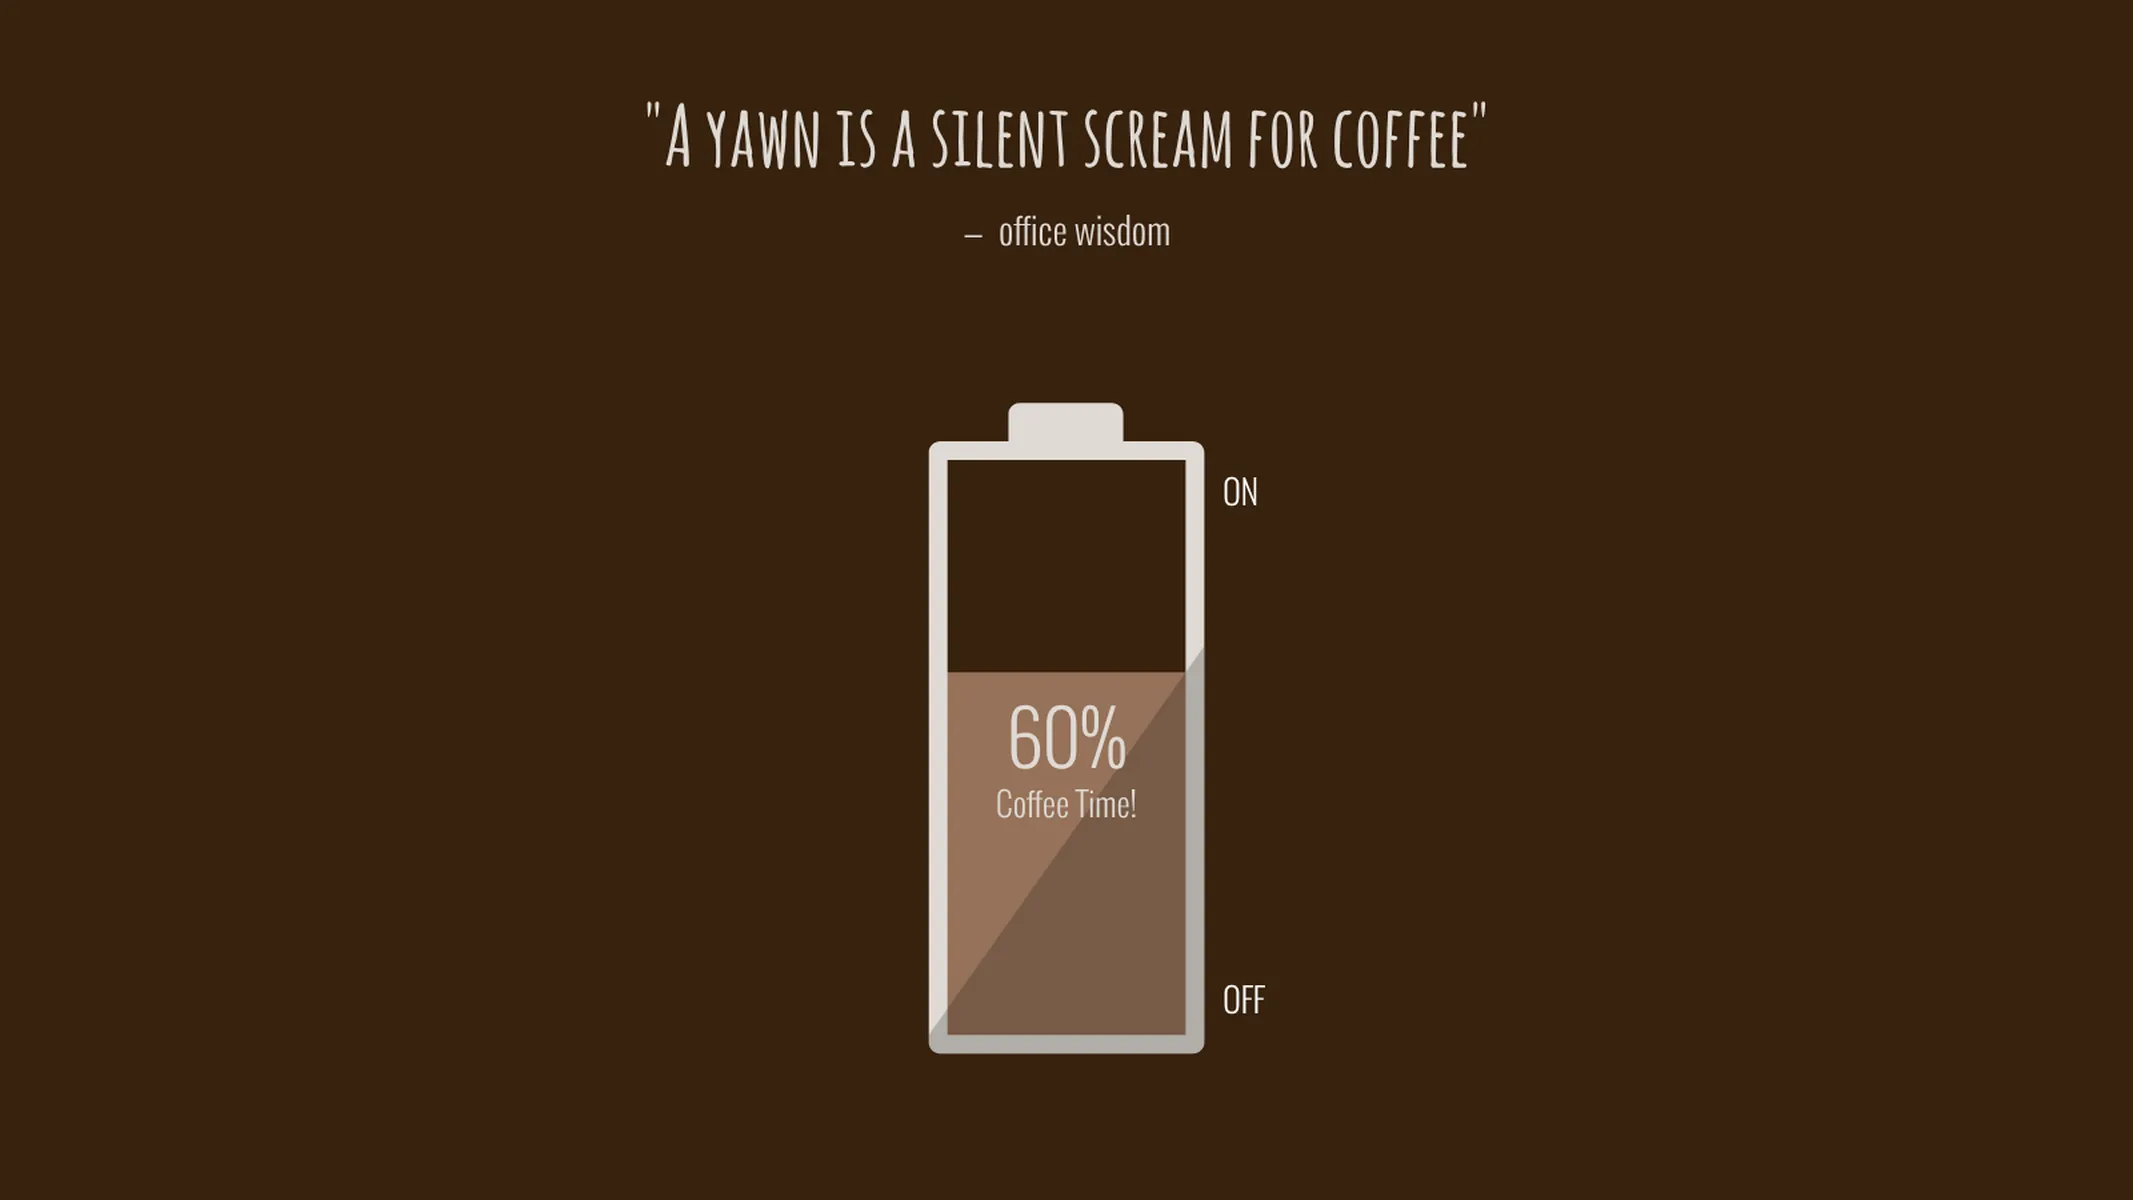
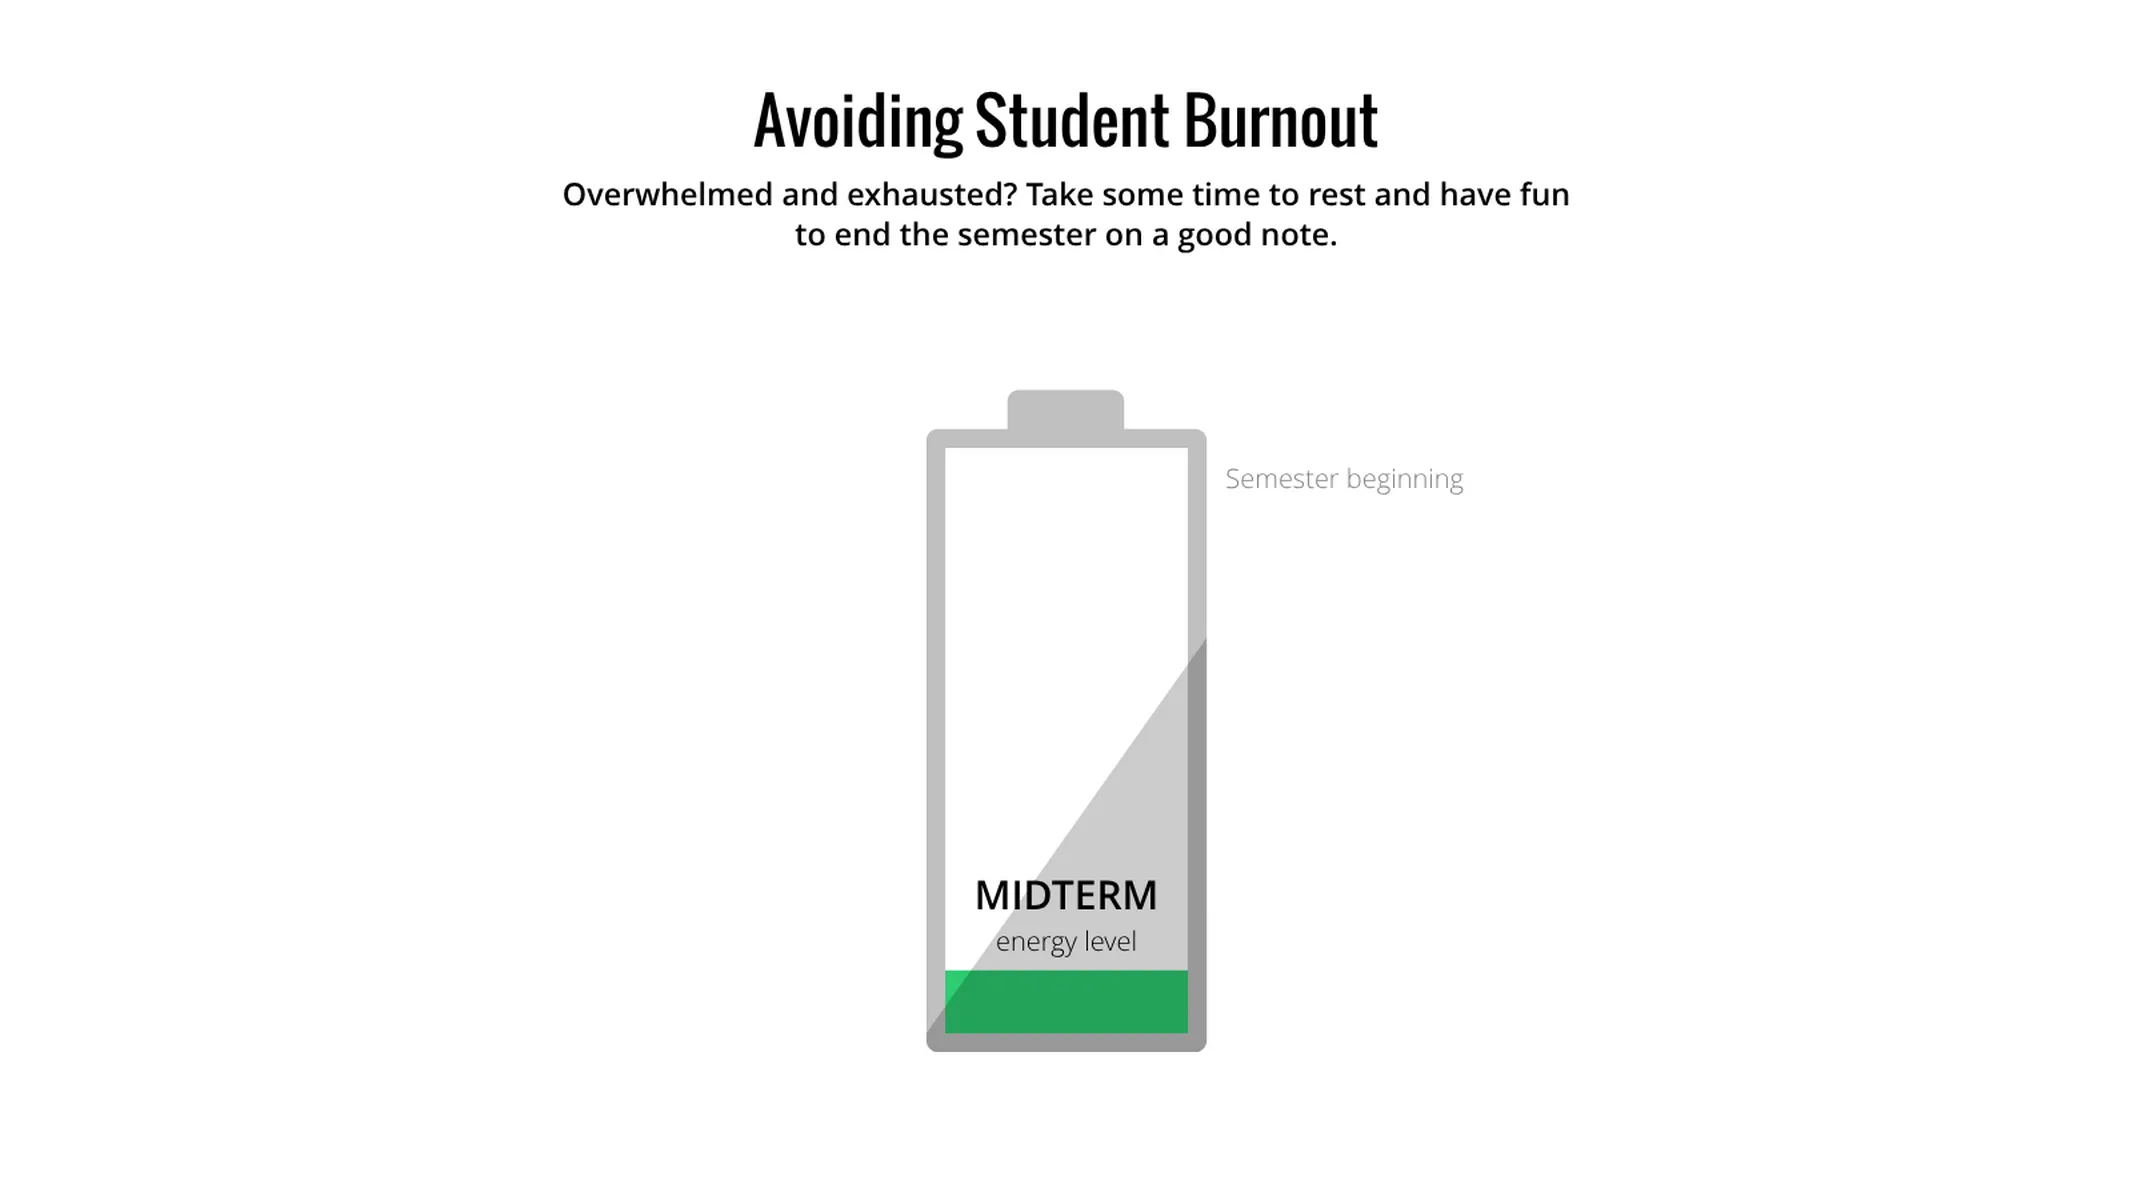
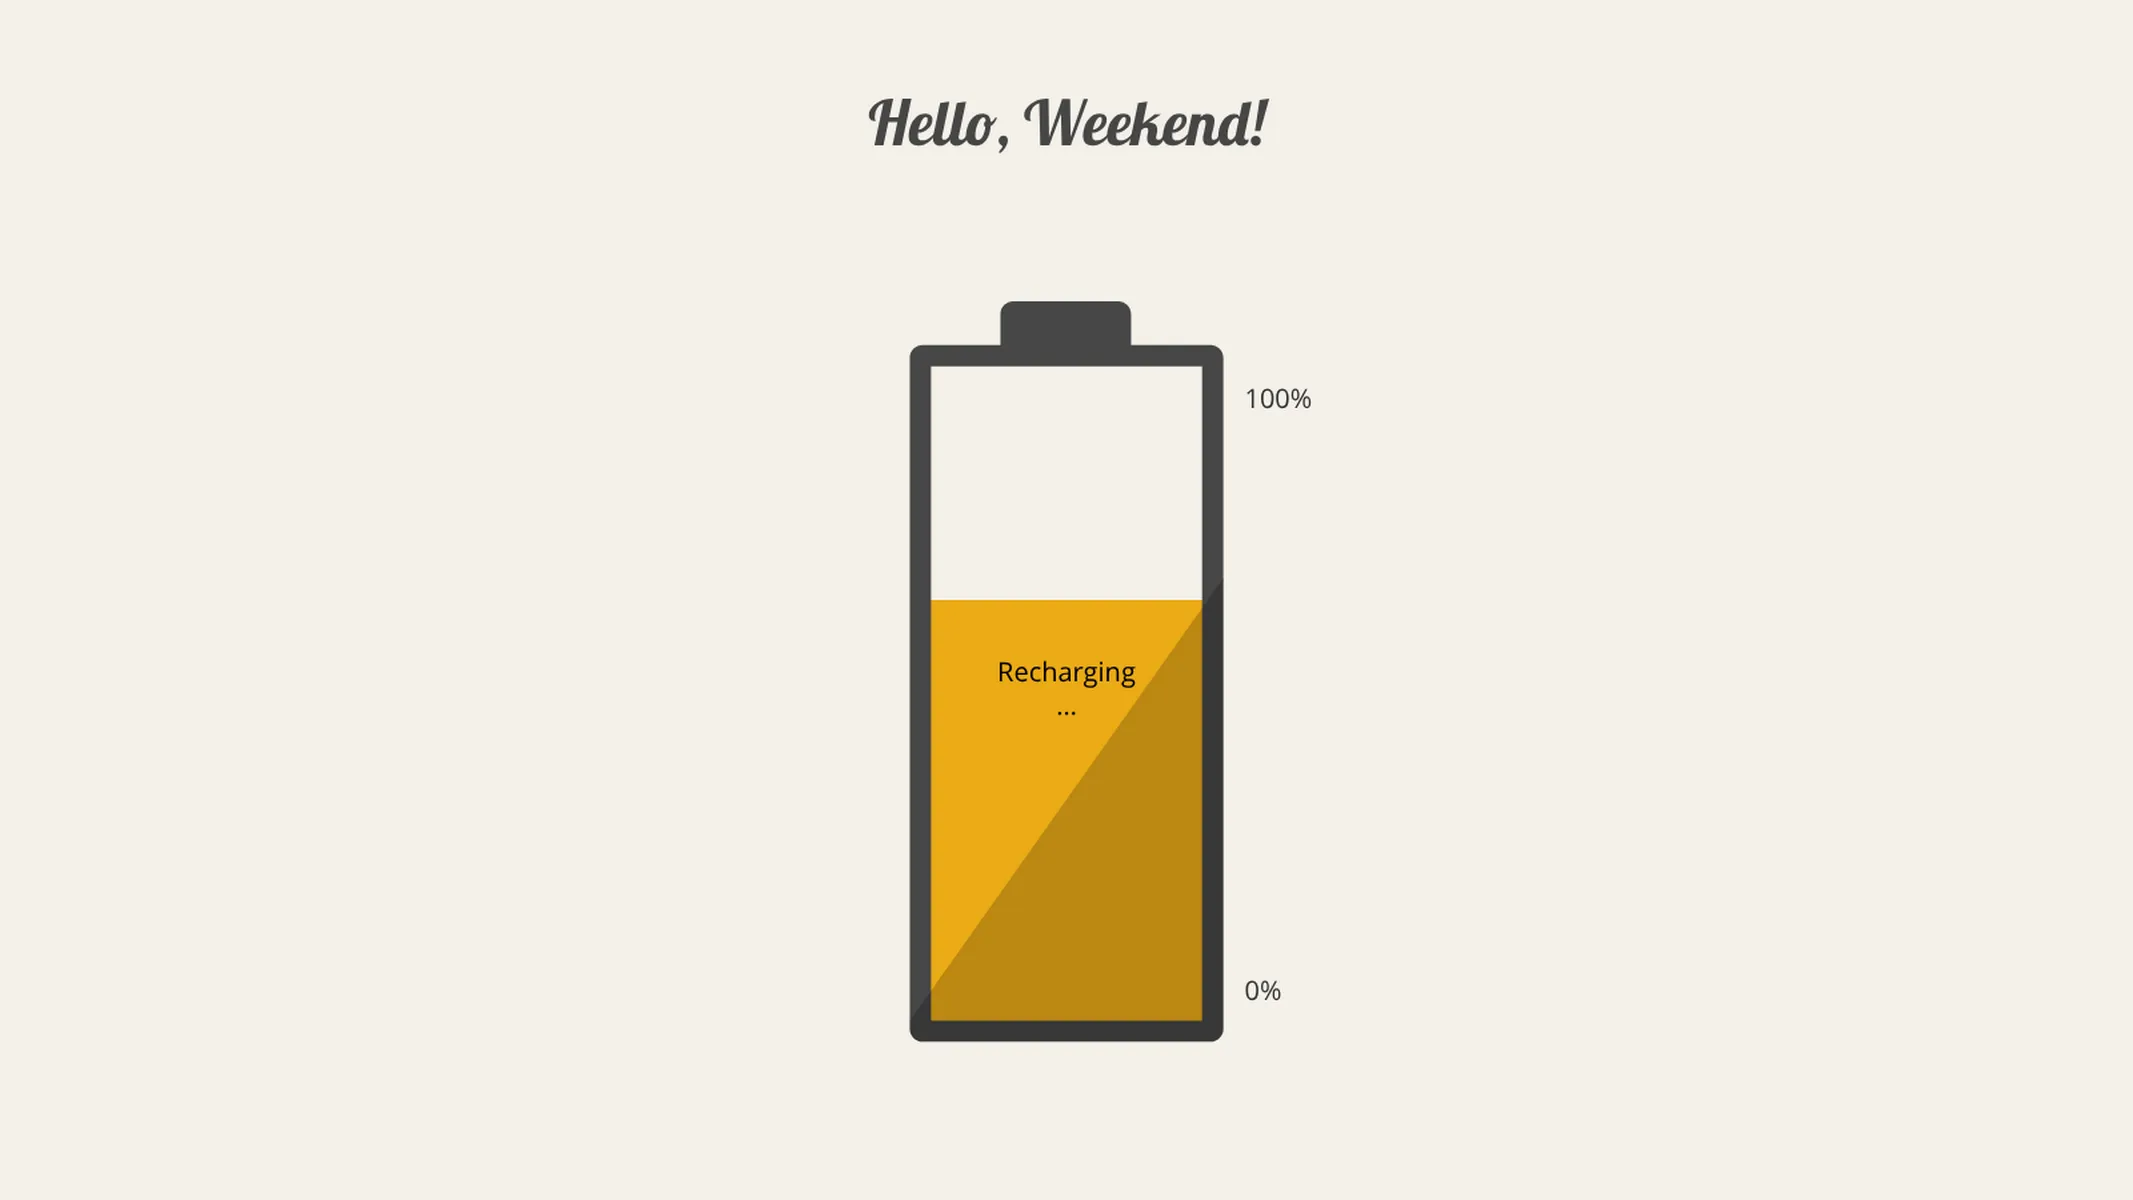
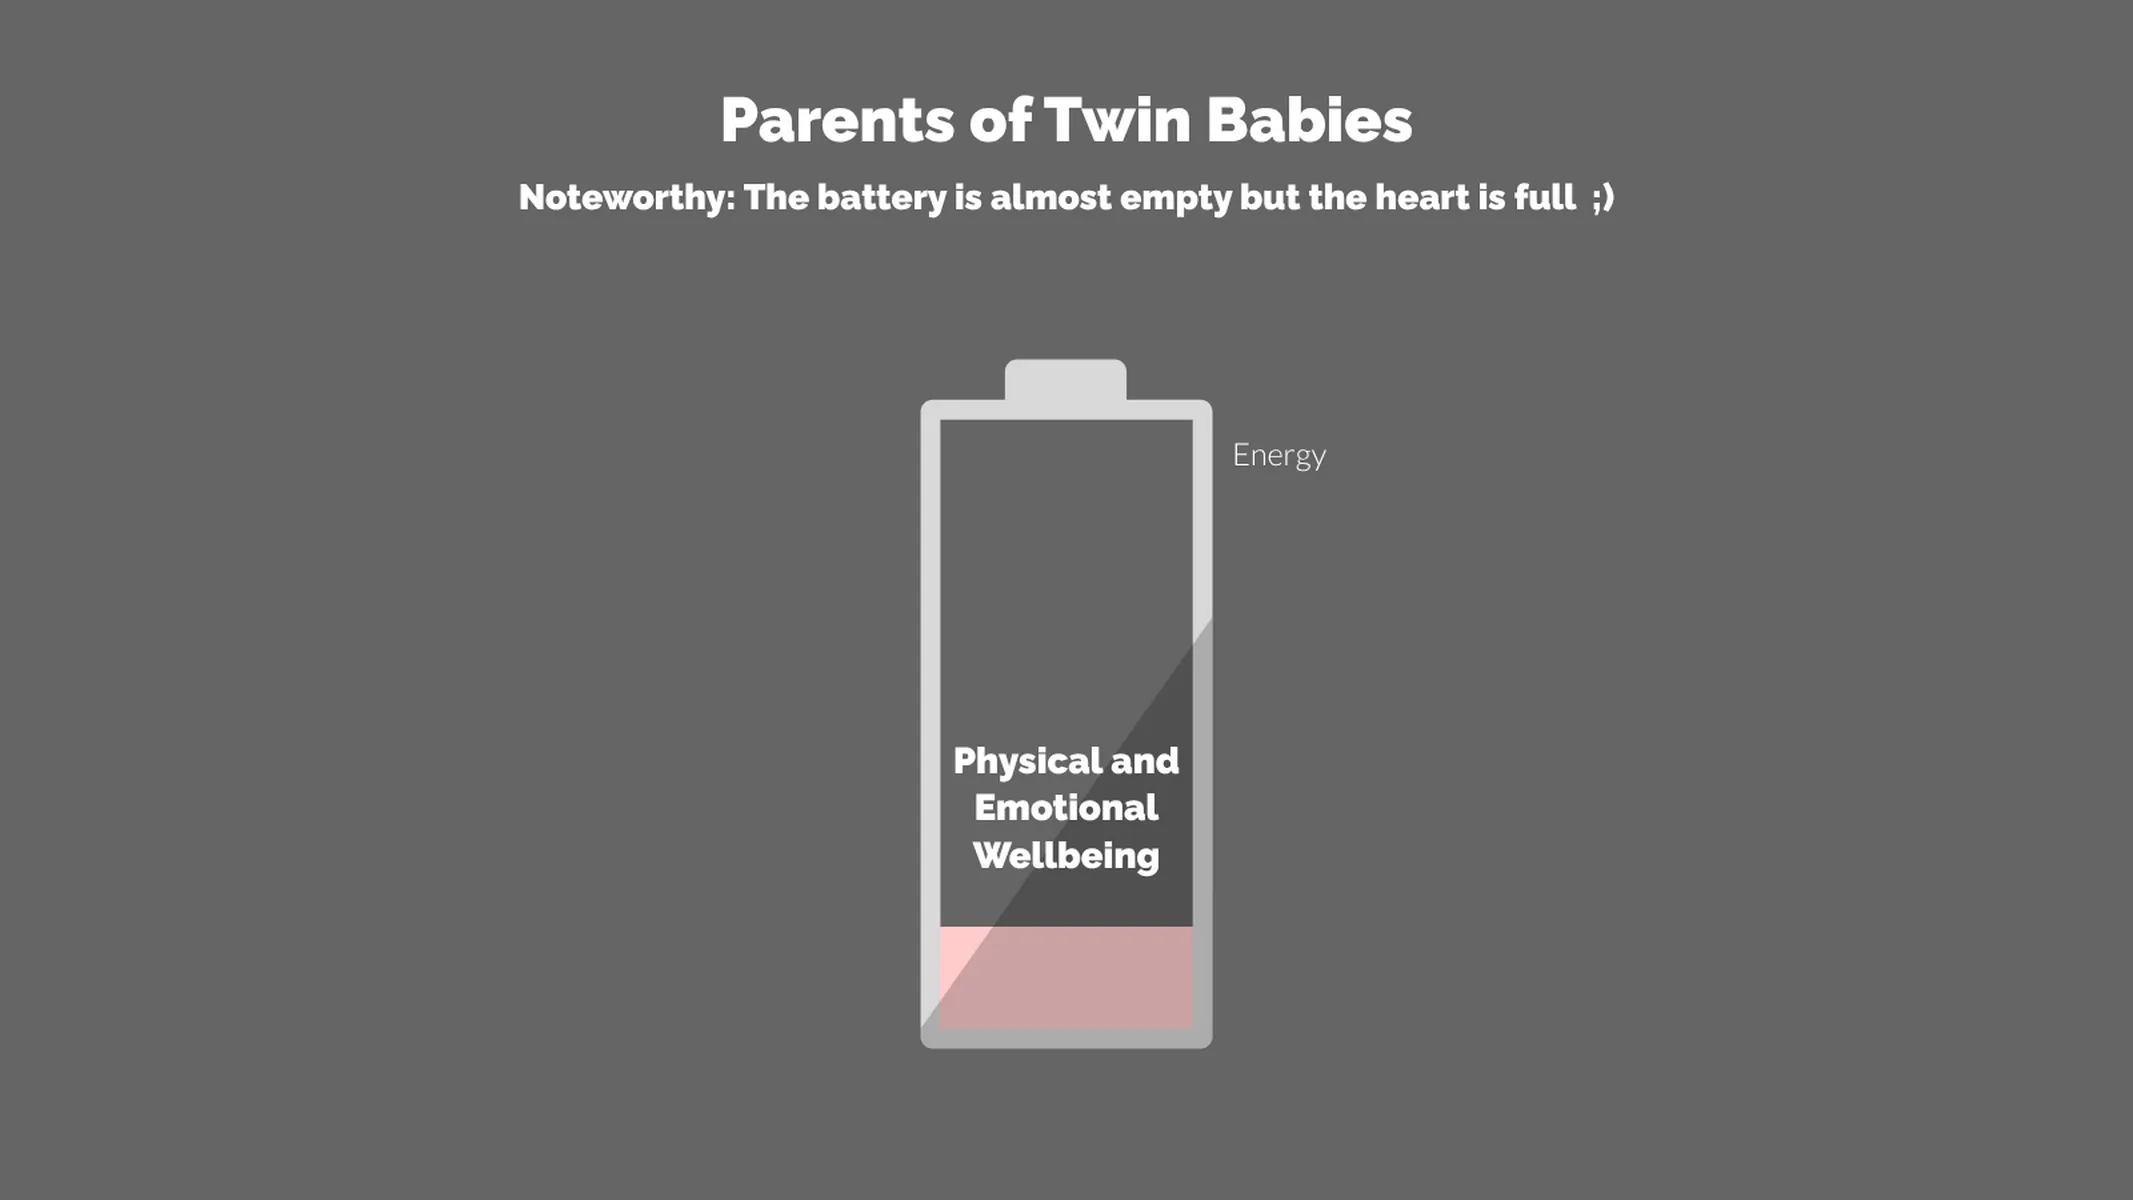
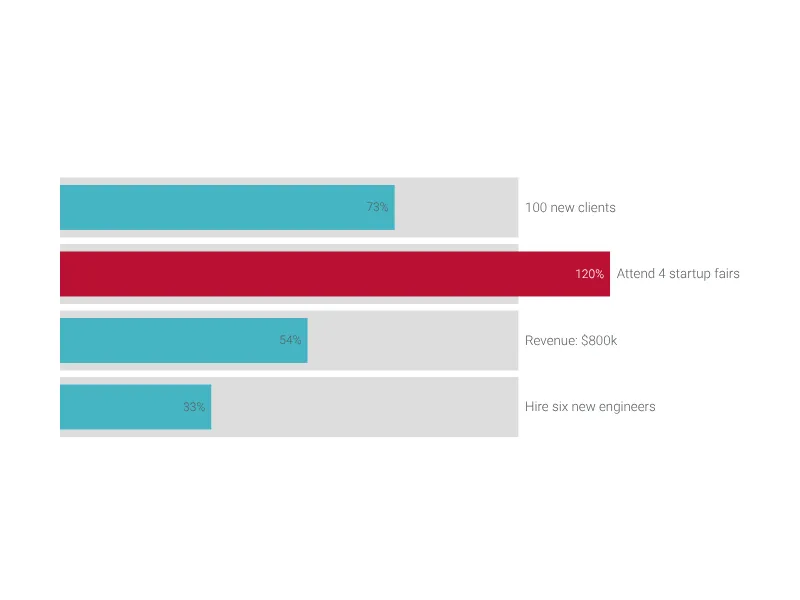
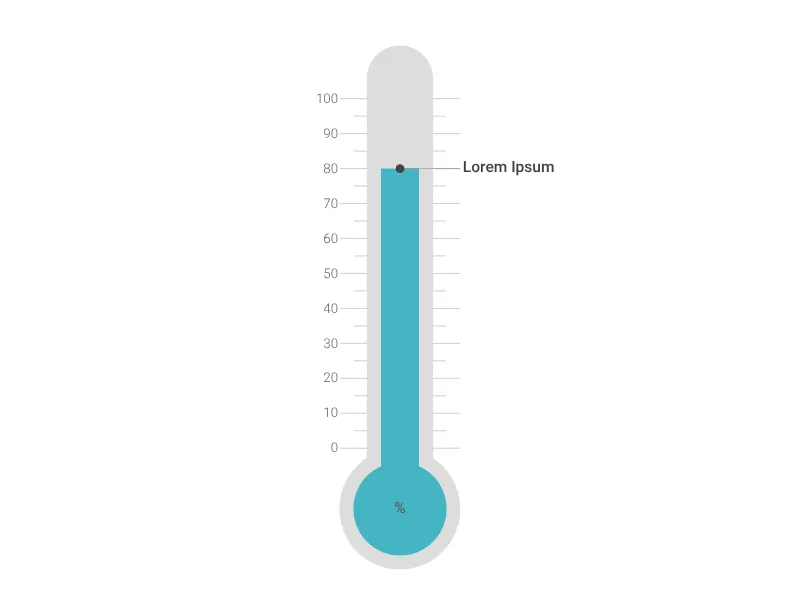
The battery is a pictoral chart that can be used to visualize a ratio or residual value. Go ahead and add some energy to your presentation.
How to make a battery chart?
- Adjust the battery level by dragging the handle with the battery itself or by using the “RATIO” slider located on the “APPEARANCE” tab.
- Change the title of the battery to suit your specific needs
Battery chart maker: key features
- Custom colors and label formatting
Battery Chart: What's new?
Read more in our Changelog.
Battery Chart Alternatives

Enhance your productivity
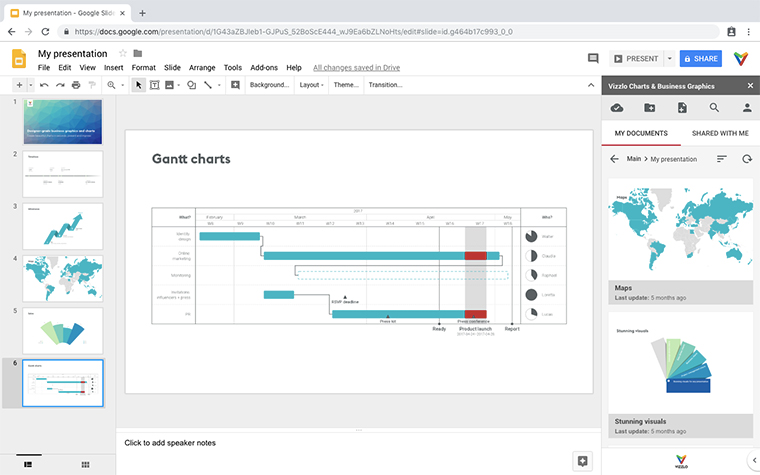
Create a Battery Chart directly in the tools you love
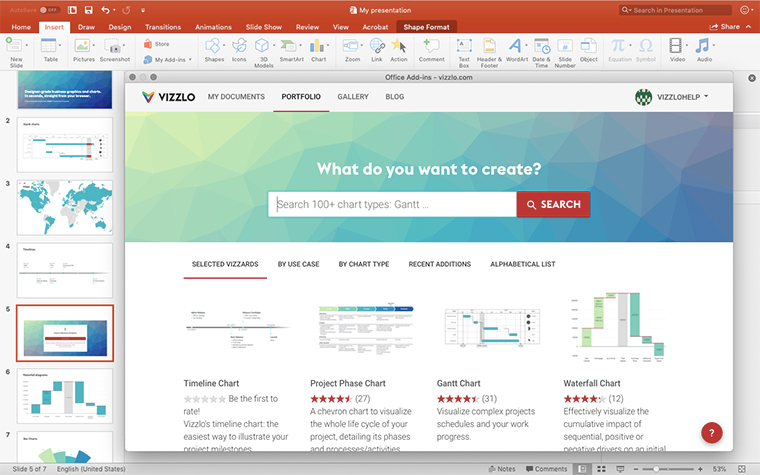
Create a Battery Chart in PowerPoint with
Vizzlo's add-in
Loved by professionals around the world







Visualizations your audience won’t forget
Convey abstract concepts and data with professionally designed
charts and graphics you can easily edit and customize.