Chart Vizzard
Vizzlo's AI-based chart generatorHow to Create a Venn Diagram
A Venn diagram is a great way to visualize the structure of set relationships in a metaphorical way rather than a mathematically accurate way. A Venn diagram shows all possible logical relations between a finite collection of different sets. Sets are commonly drawn as circles.
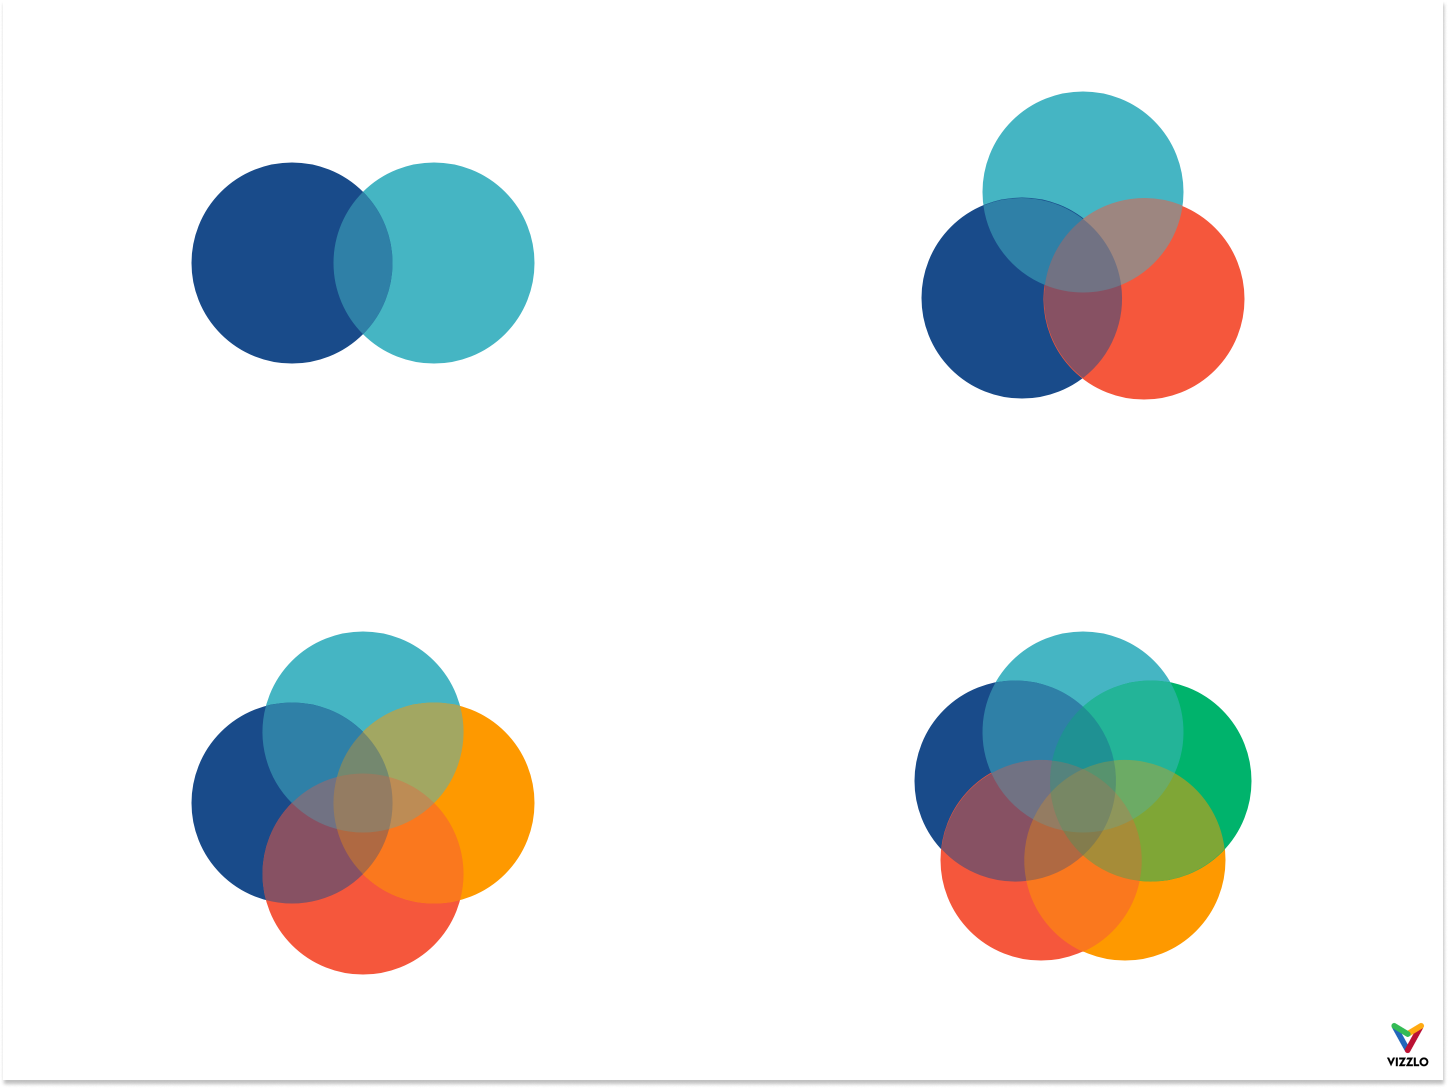
When you create a Venn diagram online with Vizzlo you can select from different templates. By default, you will see three circles. Need more? Need less? Depending on the complexity and interaction of your data, you can choose from four different templates.
Tip! You can create a Venn Diagram like this easily with Vizzlo either online, in PowerPoint or in Google Slides. Try it out!
Start creating your own charts and business graphics.
Try Vizzlo for freeThe part of the circle that does not overlap with any other circles is the area where you enter the differences. That is, it displays the characteristics only this set possesses and are not true for any other set. Overlapping areas, i.e., intersections are the areas of similarities. If the similarities are shared with more than one other circle, put them in the area where all circles for which the given feature applies overlap.
Venn To Persuade: for Presentations
Show investors, clients, and budget-gatekeepers just how large you can scale, or just how specific & accurate you can be with targeting. How is your business different from the competition? Where is there overlap?
Venn To Illustrate: for Reports
How can you show, and then re-target, different commonalities between your current customer profiles? Are there logical intersections that show opportunities currently being missed?
Venn To Compare: for Decision Makers
Can we see an increase in the cannibalization rate after your company’s new product line crowd out the existing market for your current products?
How to create a Venn Diagram in Vizzlo
- Choose from a Venn diagram template
- Add or re-position your circles
- Change the layout of the Venn diagram
- Adjust properties of any circle and label
- Export or embed your chart
Choose from a Venn diagram template
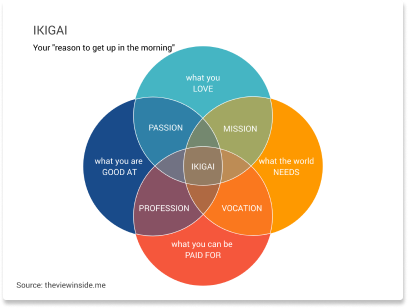
Your first step in creating a Venn diagram is to decide what you want to compare. Think of a descriptive header. Vizzlo offer templates for you so you don’t have to create a Venn diagram from scratch. Our chart gallery can help get you started. With only a few clicks, you can create a beautiful Venn diagram. Whether you want to quickly compare products and services or find similarities between religions, we have templates to get you started. Even though a Venn diagram with 3 circles or one with two is the most common, you can easily add more circles and create intriguing and more complex diagrams, like this quadruple diagram on Ikigai.
Add or re-position your circles
After you added all your circles, make sure each of them at least overlaps with one other circle. Vizzlo’s Venn diagram is completely interactive. You can use drag and drop simplicity to reposition any element of the chart.
Change the layout of the Venn diagram
The preset light transparency of Vizzlo’s Venn diagram template makes it easy to spot intersections and relationships at first glance.
Adjust properties of any circle and label
You can easily change the colors of your circles to fit your companies color scheme or to better correlate with the data you are trying to visualize. A good tip is to correlate the color to your data in a way that makes sense intuitively, so people can easily process the information. For example with weather data, temperature is usually associated with red, precipitation with blue, and so on.
Styling the labels with a proper font and color will make it easier to read and understand. Use labels in a way that they can’t be confused with another circle. You can just click and drag labels in Vizzlo to position them in a way that is easy to understand and avoids confusion. If you click on any circle or intersection, you can enter a headline as well as content so it’s easily distinguishable.
Export or embed your chart
After you are done editing your diagram, you can export it as a high-quality PDF or PNG. And of course our Venn diagram is printable directly from the editor.
Vizzlo is an online tool to create beautiful charts and business graphics. Besides our web application, you can embed your Venn diagram and all other charts that you created online easily into PowerPoint or Google slides using our add-ins.
Start designing your own charts and business graphics.
Try Vizzlo for free