Chart Vizzard
Vizzlo's AI-based chart generatorFinancial burden of the total housing cost

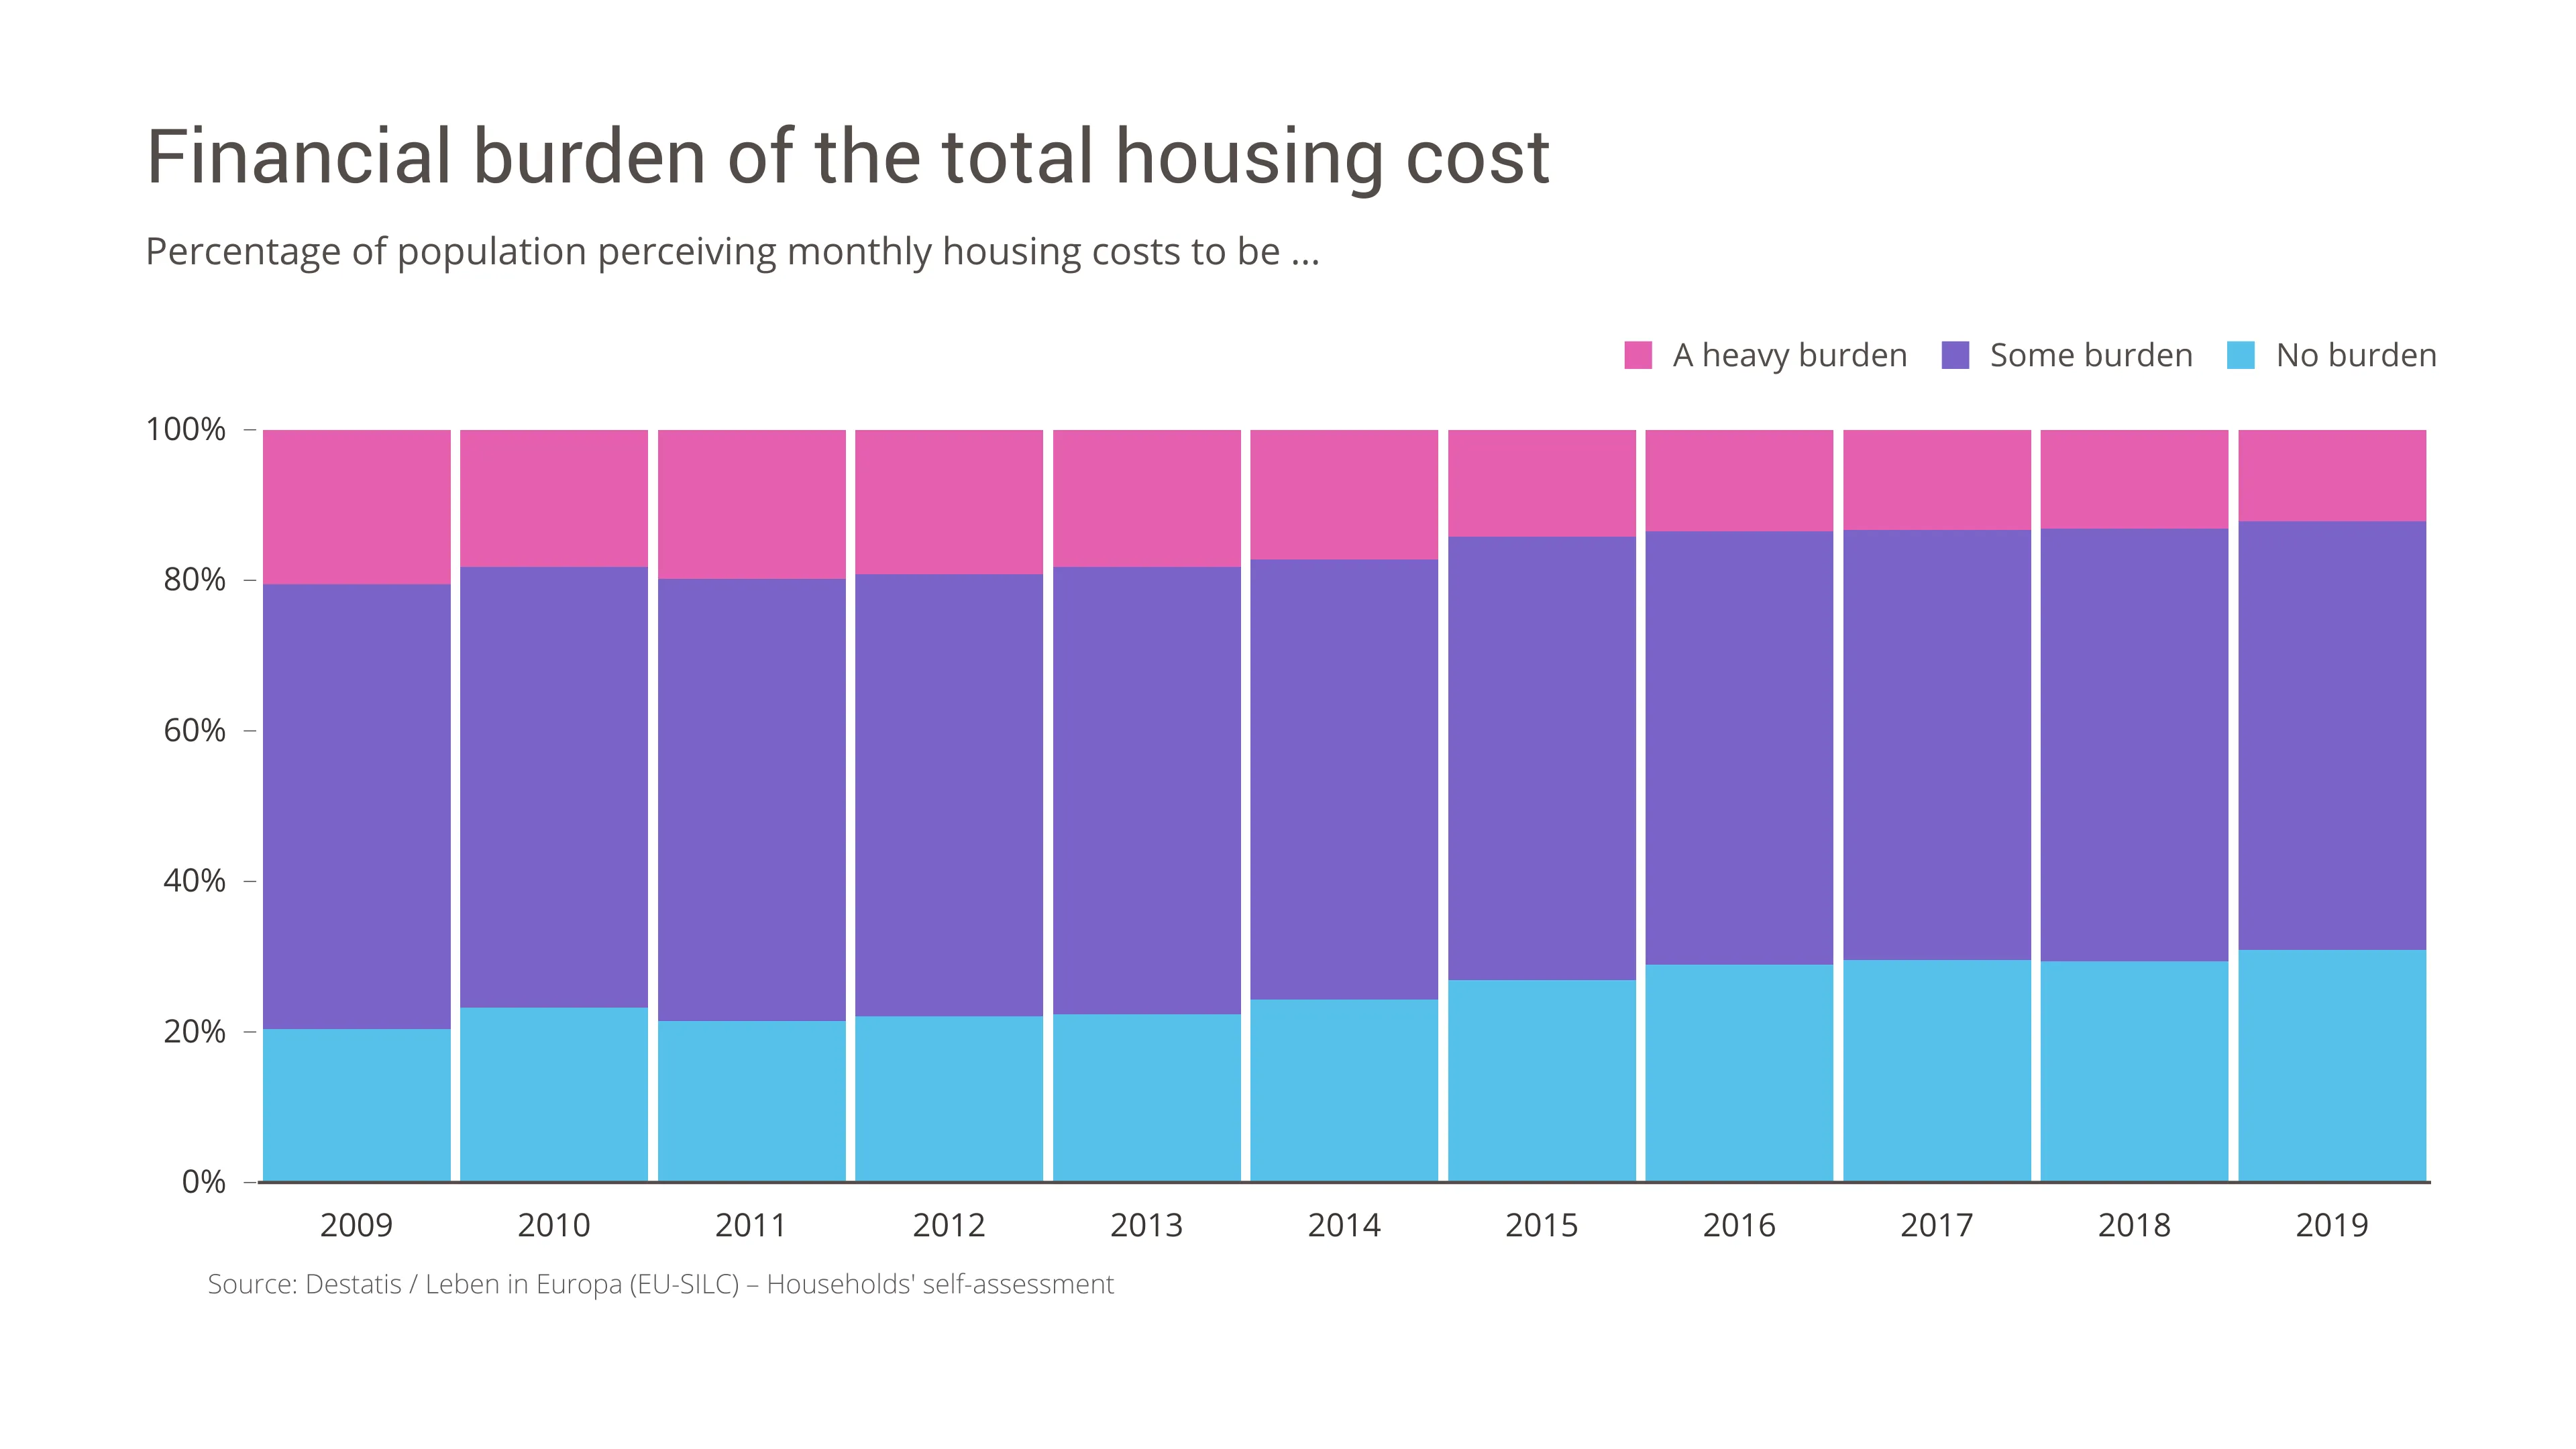
In this weeks gallery post we look at the Financial burden of the total housing cost.
We were quite surprised when we saw that the share of people who perceive their monthly housing costs to be no burden rose from 20.4% in 2009 to 30.9% in 2019. And that’s also true for people at risk of poverty, but on a lower level: in 2009 only 15.9% perceived their monthly housing costs to be no burden, in 2019 25.0%.
That data is even more astonishing when we take the Housing costs as a proportion of disposable net household income into acount. Altough overall the housing costs decreased from 30.9% to 25.9%, for people with a risk of poverty the housing costs stayed at a constant level of around 50% of their disposable net household income.
Of course, the interpretation of the data needs to take several aspects into account, the development of income and income inequality, the different living conditions in rural and urban areas and so on. But nevertheless: it seems people are more willing to accept their cost of living than ten years before.

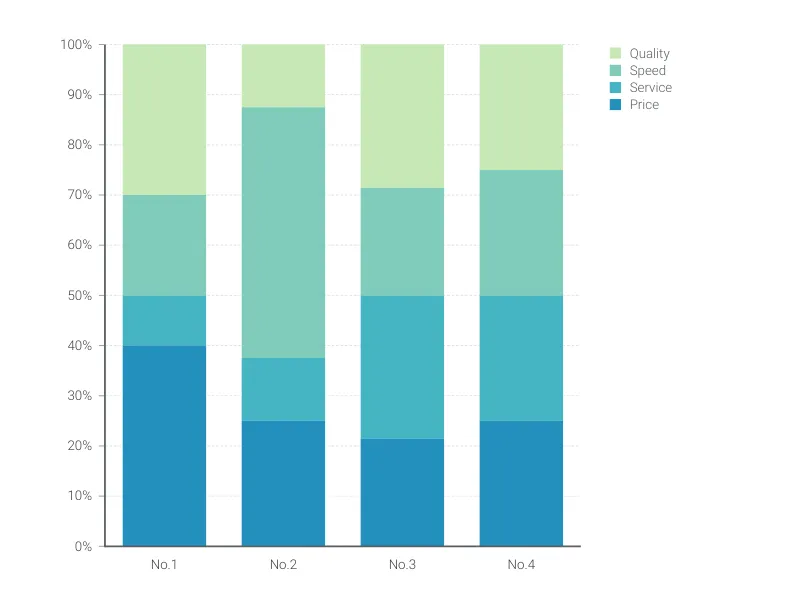
This is an example of Vizzlo's “100% Stacked Bar Chart”
Create a stacked bar chart that adds up to 100%.