Chart Vizzard
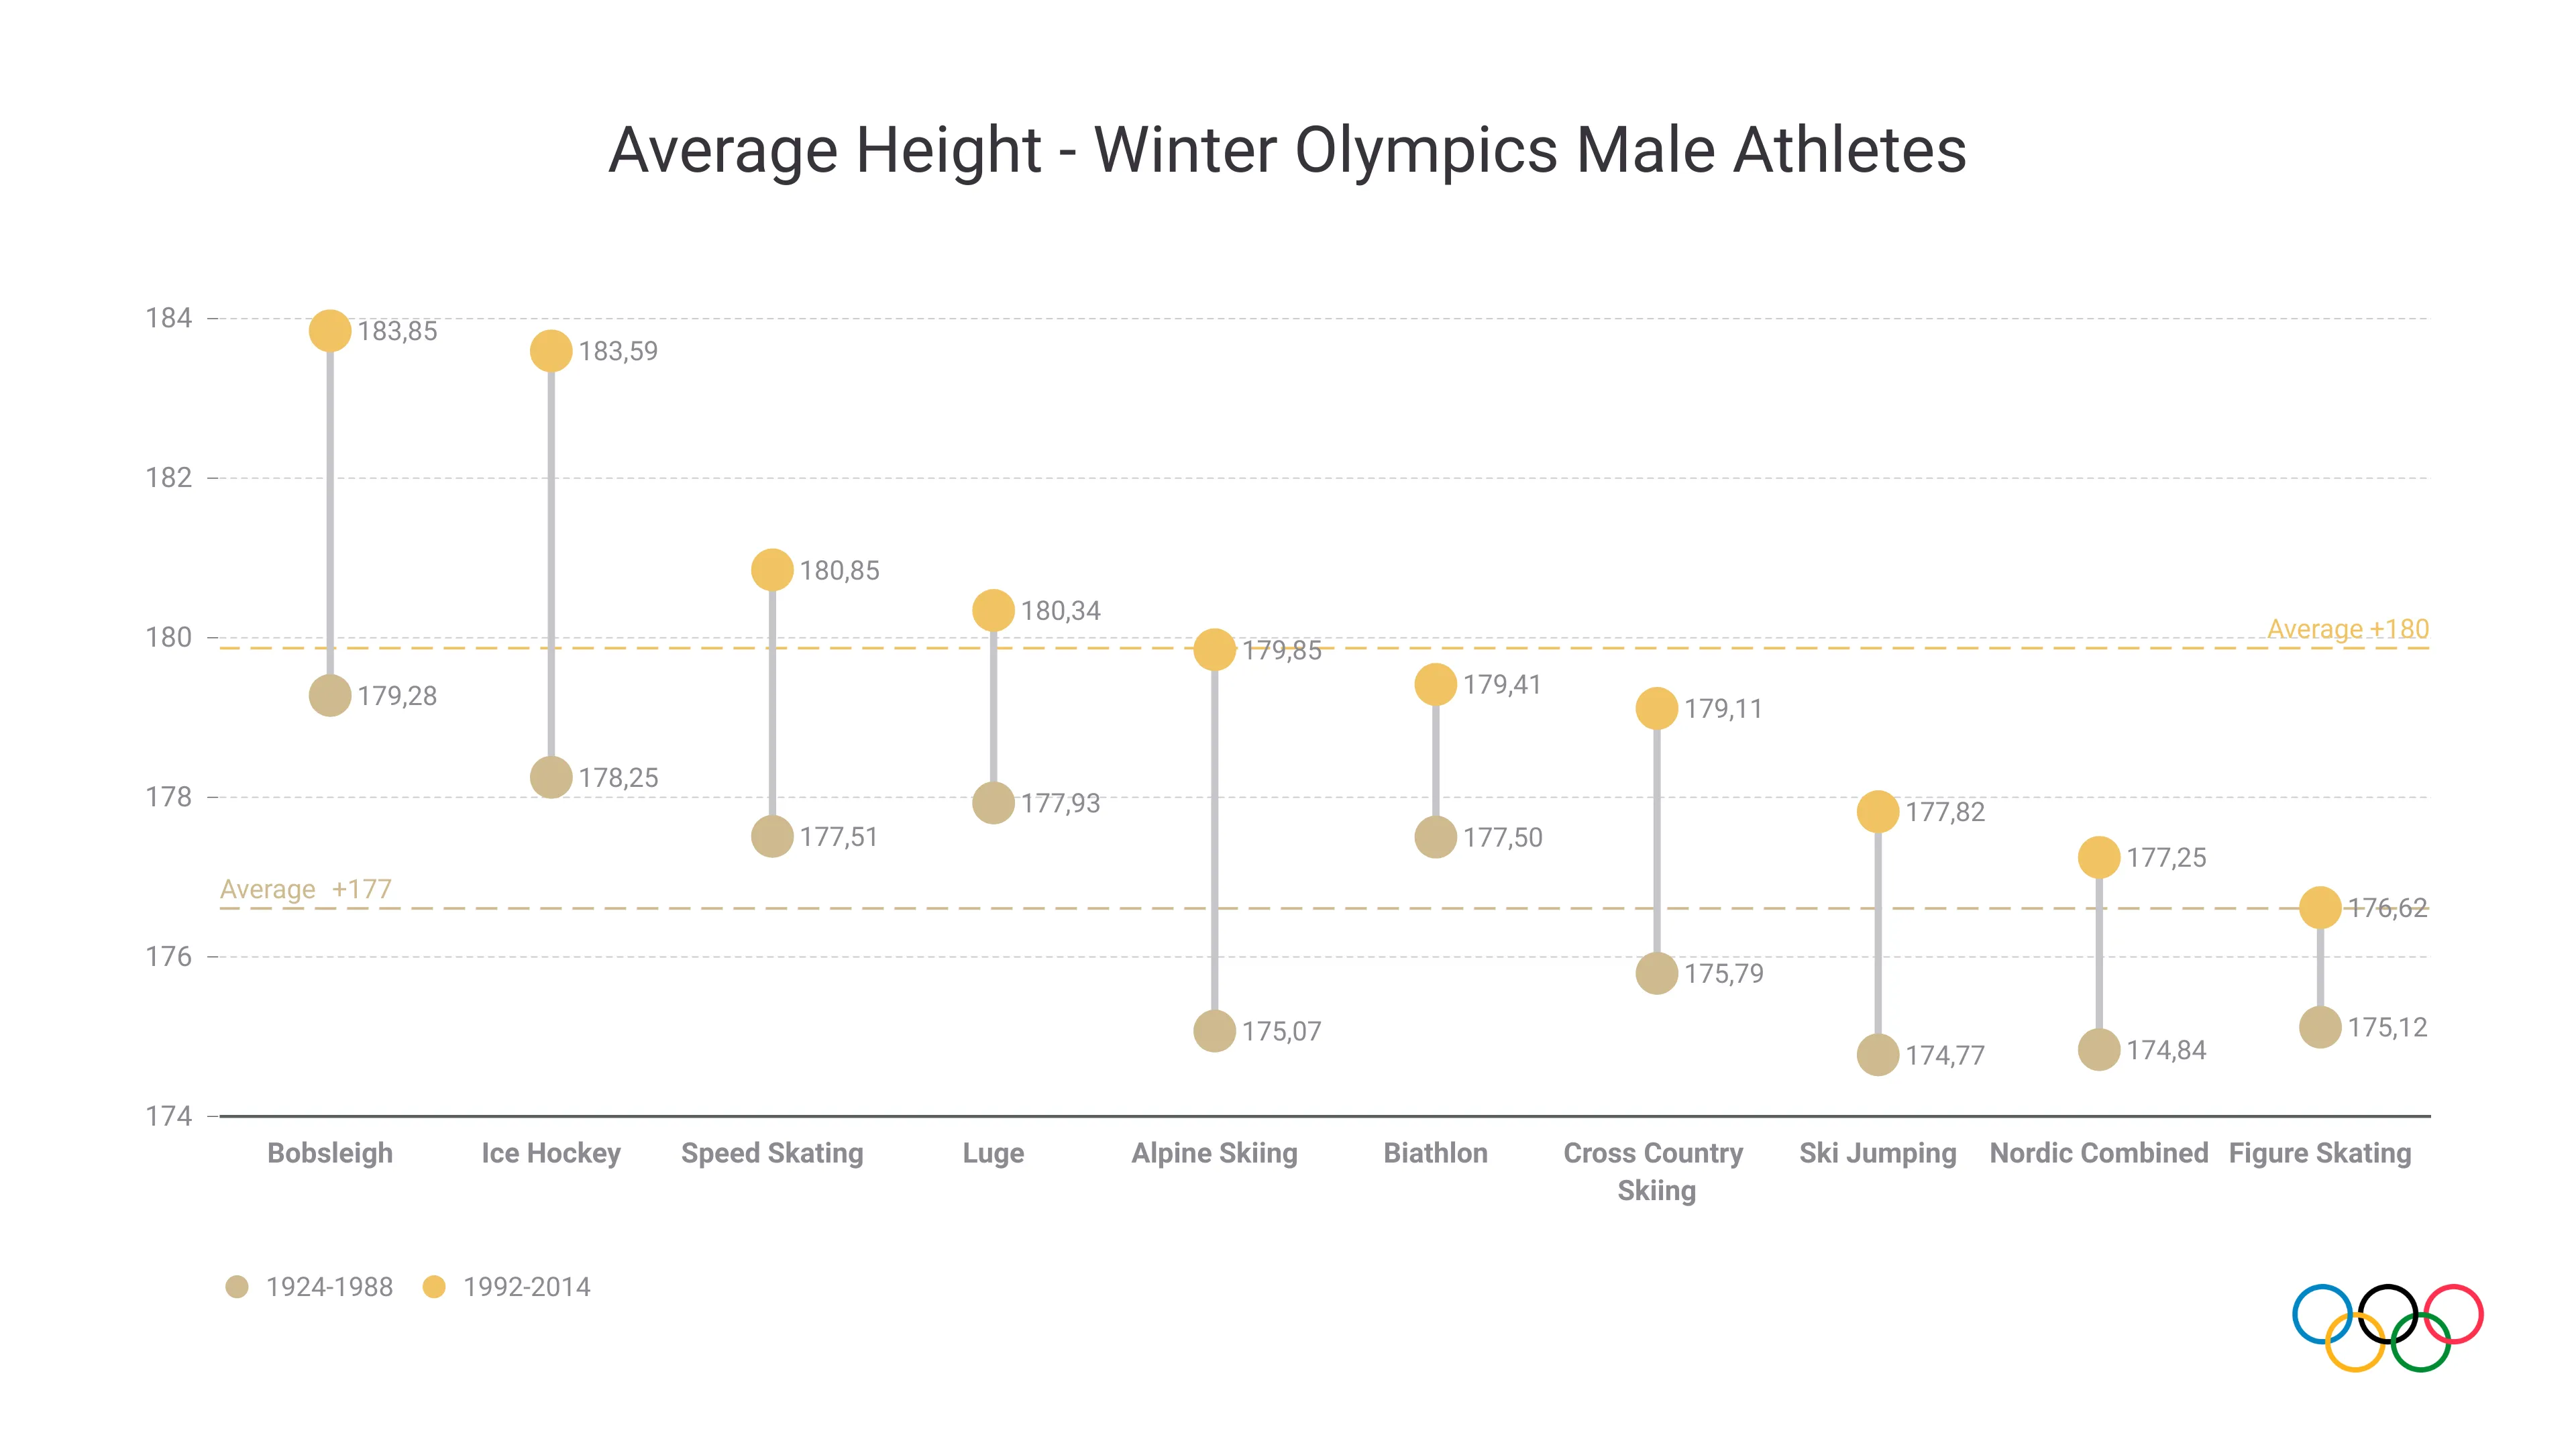
Vizzlo's AI-based chart generatorAverage Height - Winter Olympics Male Athletes

The increase in competitiveness in Olympic sports has increased greatly over the years. Originally an event to celebrate the Olympic spirit, the Olympics today are a stage for clashes between the main global powers, and in a way it ends up reflecting the rivalries of world geopolitics.
One of the results of this is the change in the bodies of athletes. This chart shows the difference in the average height of male athletes in the winter games, comparing the periods before and after 1992. There was an average increase of 3cm, and in some sports, this increase reached 7cm, as is the case of Alpine Skiing.
Source: Kaggle - 120 years of Olympic history: athletes and results

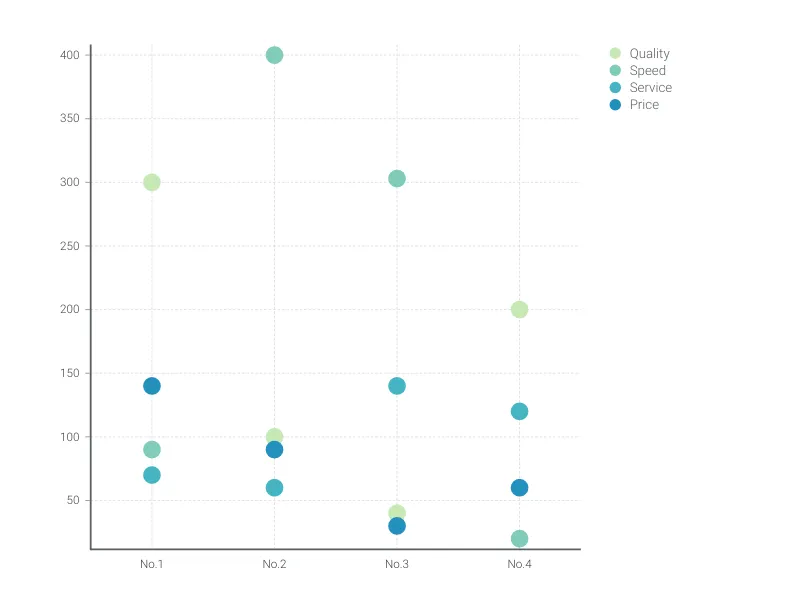
This is an example of Vizzlo's “Dot Plot Chart”
The dot plot chart is a visually appealing alternative to the bar chart for single or multiple categories of data.