Chart Vizzard
Vizzlo's AI-based chart generatorHerd immunity threshold

Vaccination has resulted in substantial reductions in morbidity and mortality from childhood diseases all over the world. Typically, herd immunity is discussed as a desirable result of wide-scale vaccination programs.
Herd immunity is when a virus cannot spread because it repeatedly encounters people who are protected against infection. Once a sufficient proportion of the population is no longer vulnerable, any new outbreak peters out.
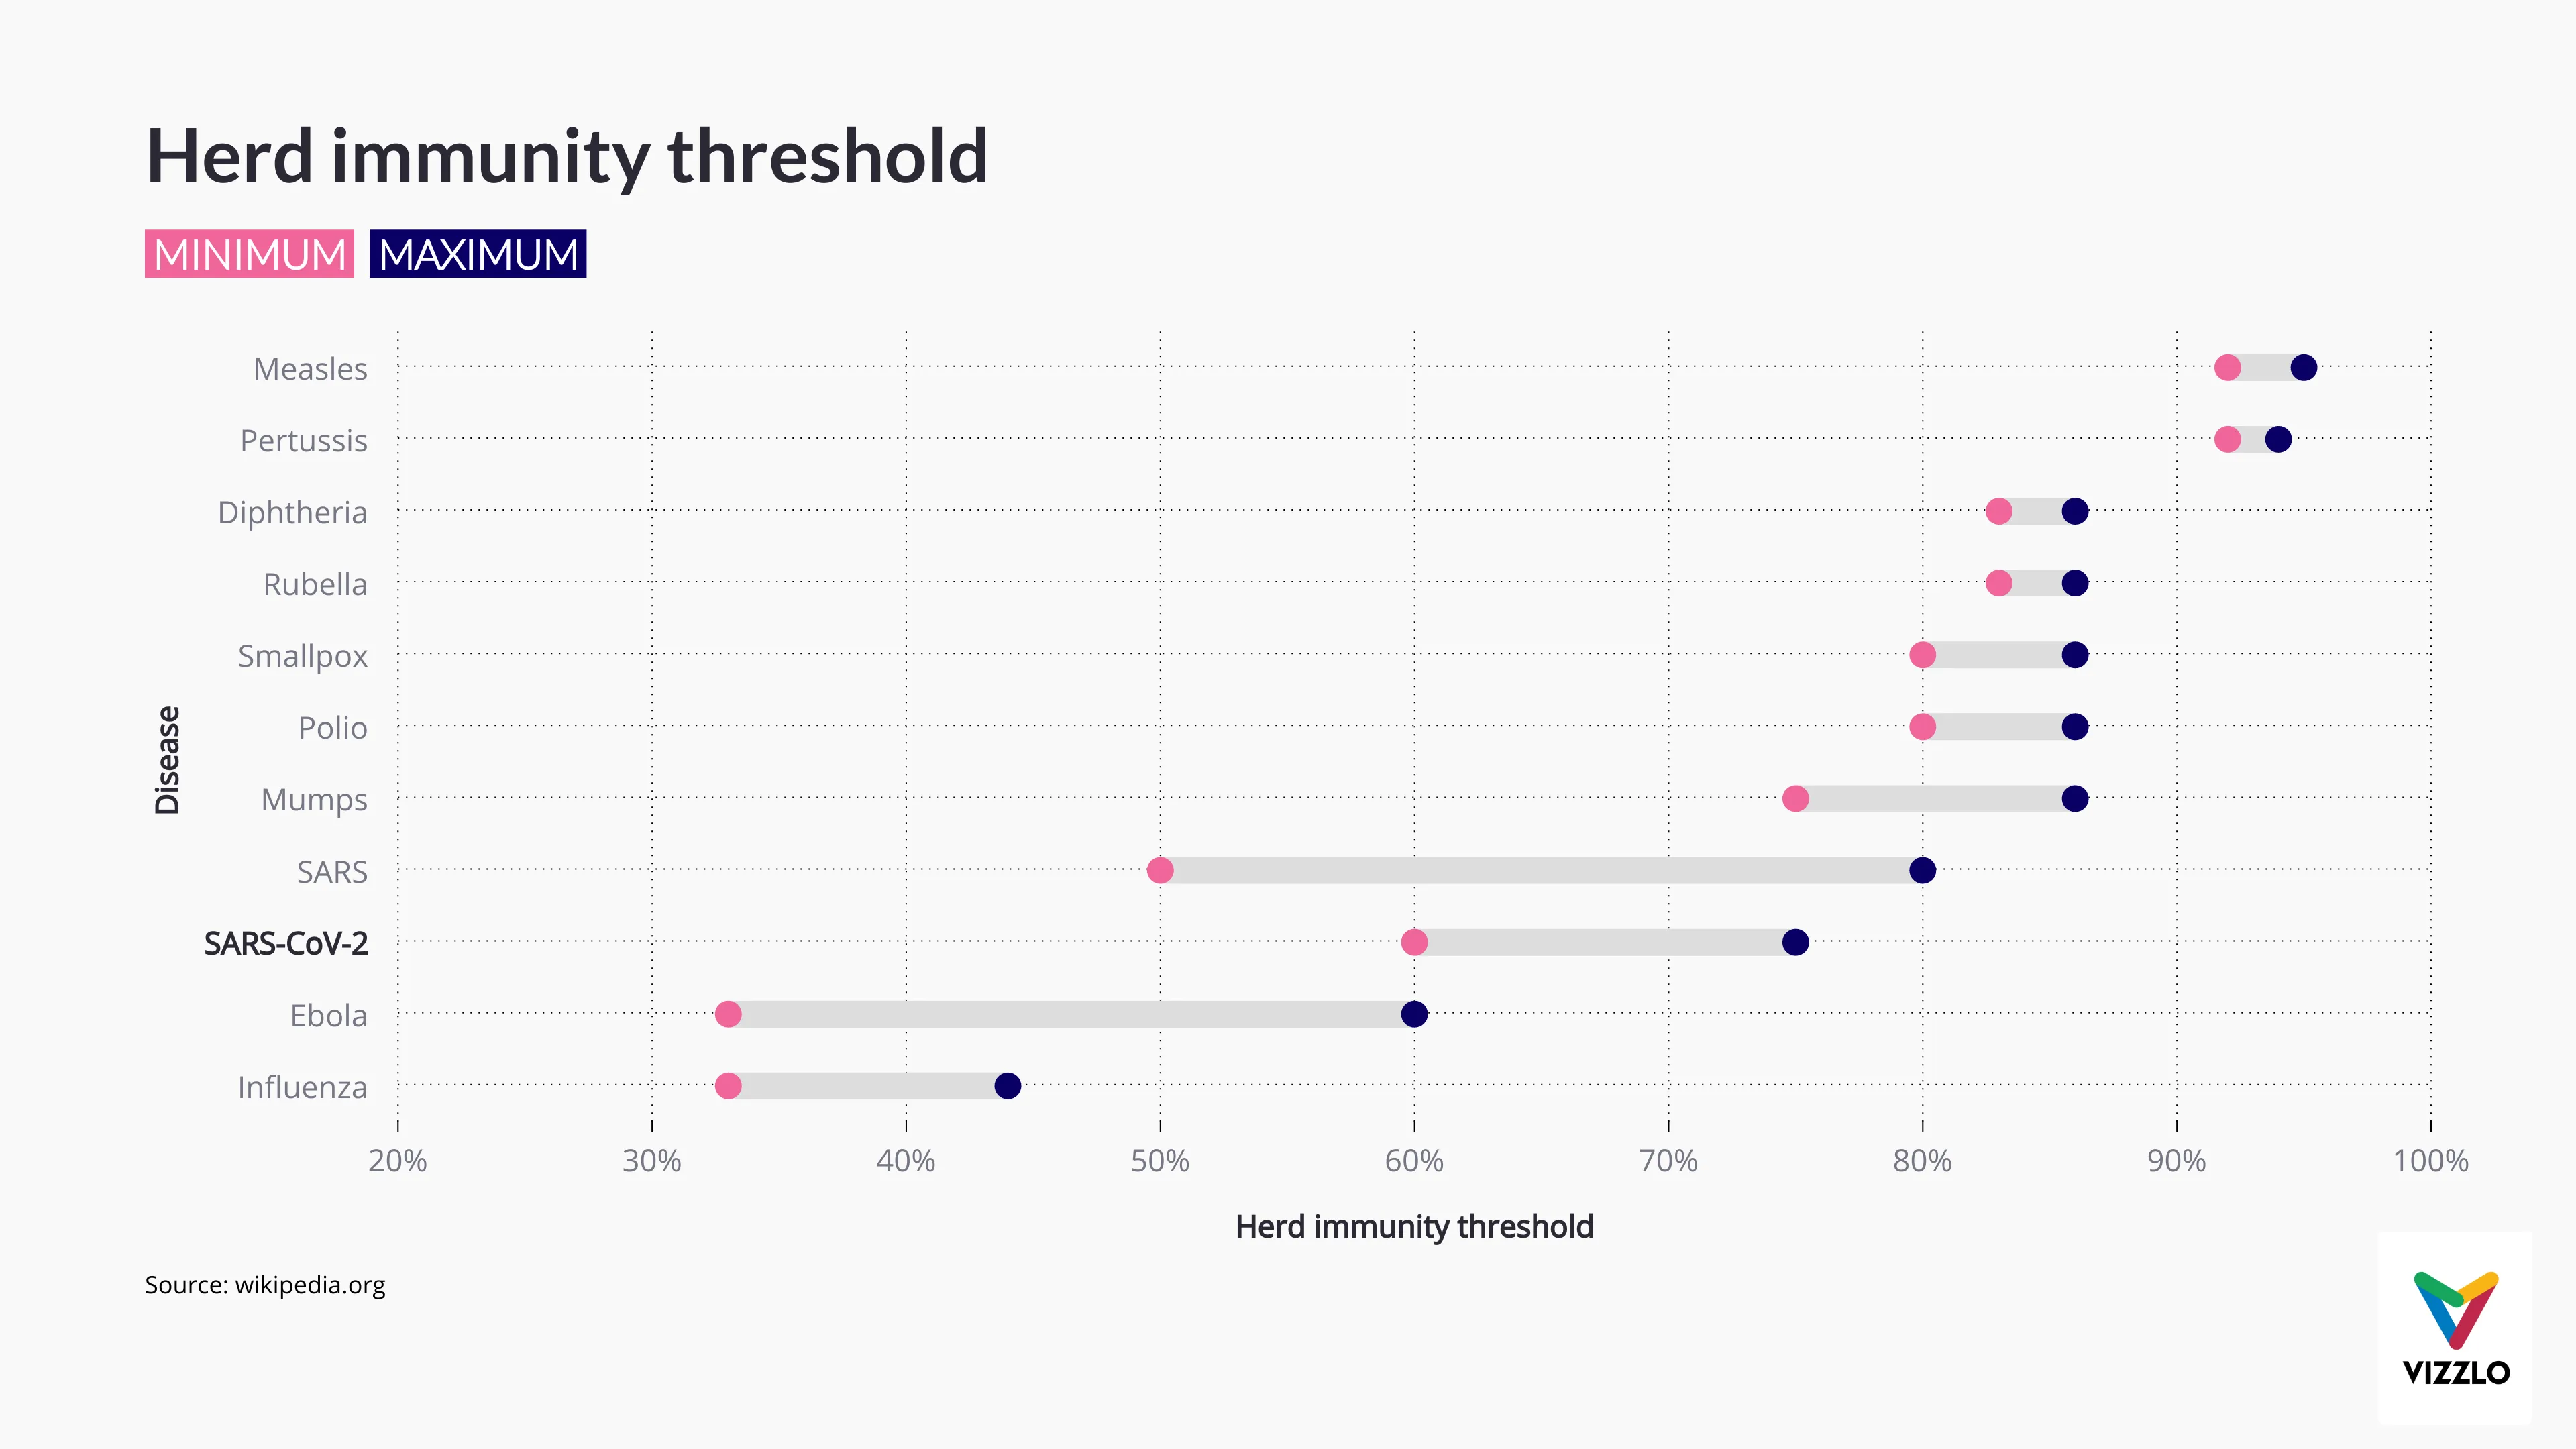
The exact herd immunity threshold (HIT) varies depending on the disease and is not to understand as a steady state, but more of a gradient. An example of a disease with a low threshold is influenza, with HIT of 33–44%. An example of a disease with a high threshold is measles, with a HIT of 92–95%.
Reaching herd immunity depends on many factors, in part on what’s happening in the population.
Note: We are still learning about immunity to COVID-19. Most people who are infected with COVID-19 develop an immune response within the first few weeks, but it is unknown how strong that immune response is, or how it differs for different people. There have also been reports of people infected with COVID-19 for a second time.
Sources:

This is an example of Vizzlo's “Dot Plot Chart”
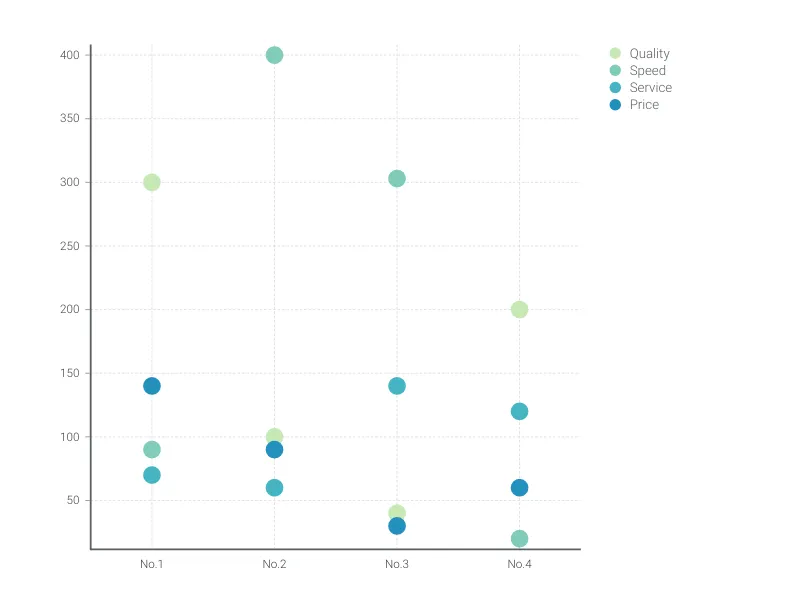
The dot plot chart is a visually appealing alternative to the bar chart for single or multiple categories of data.