Chart Vizzard
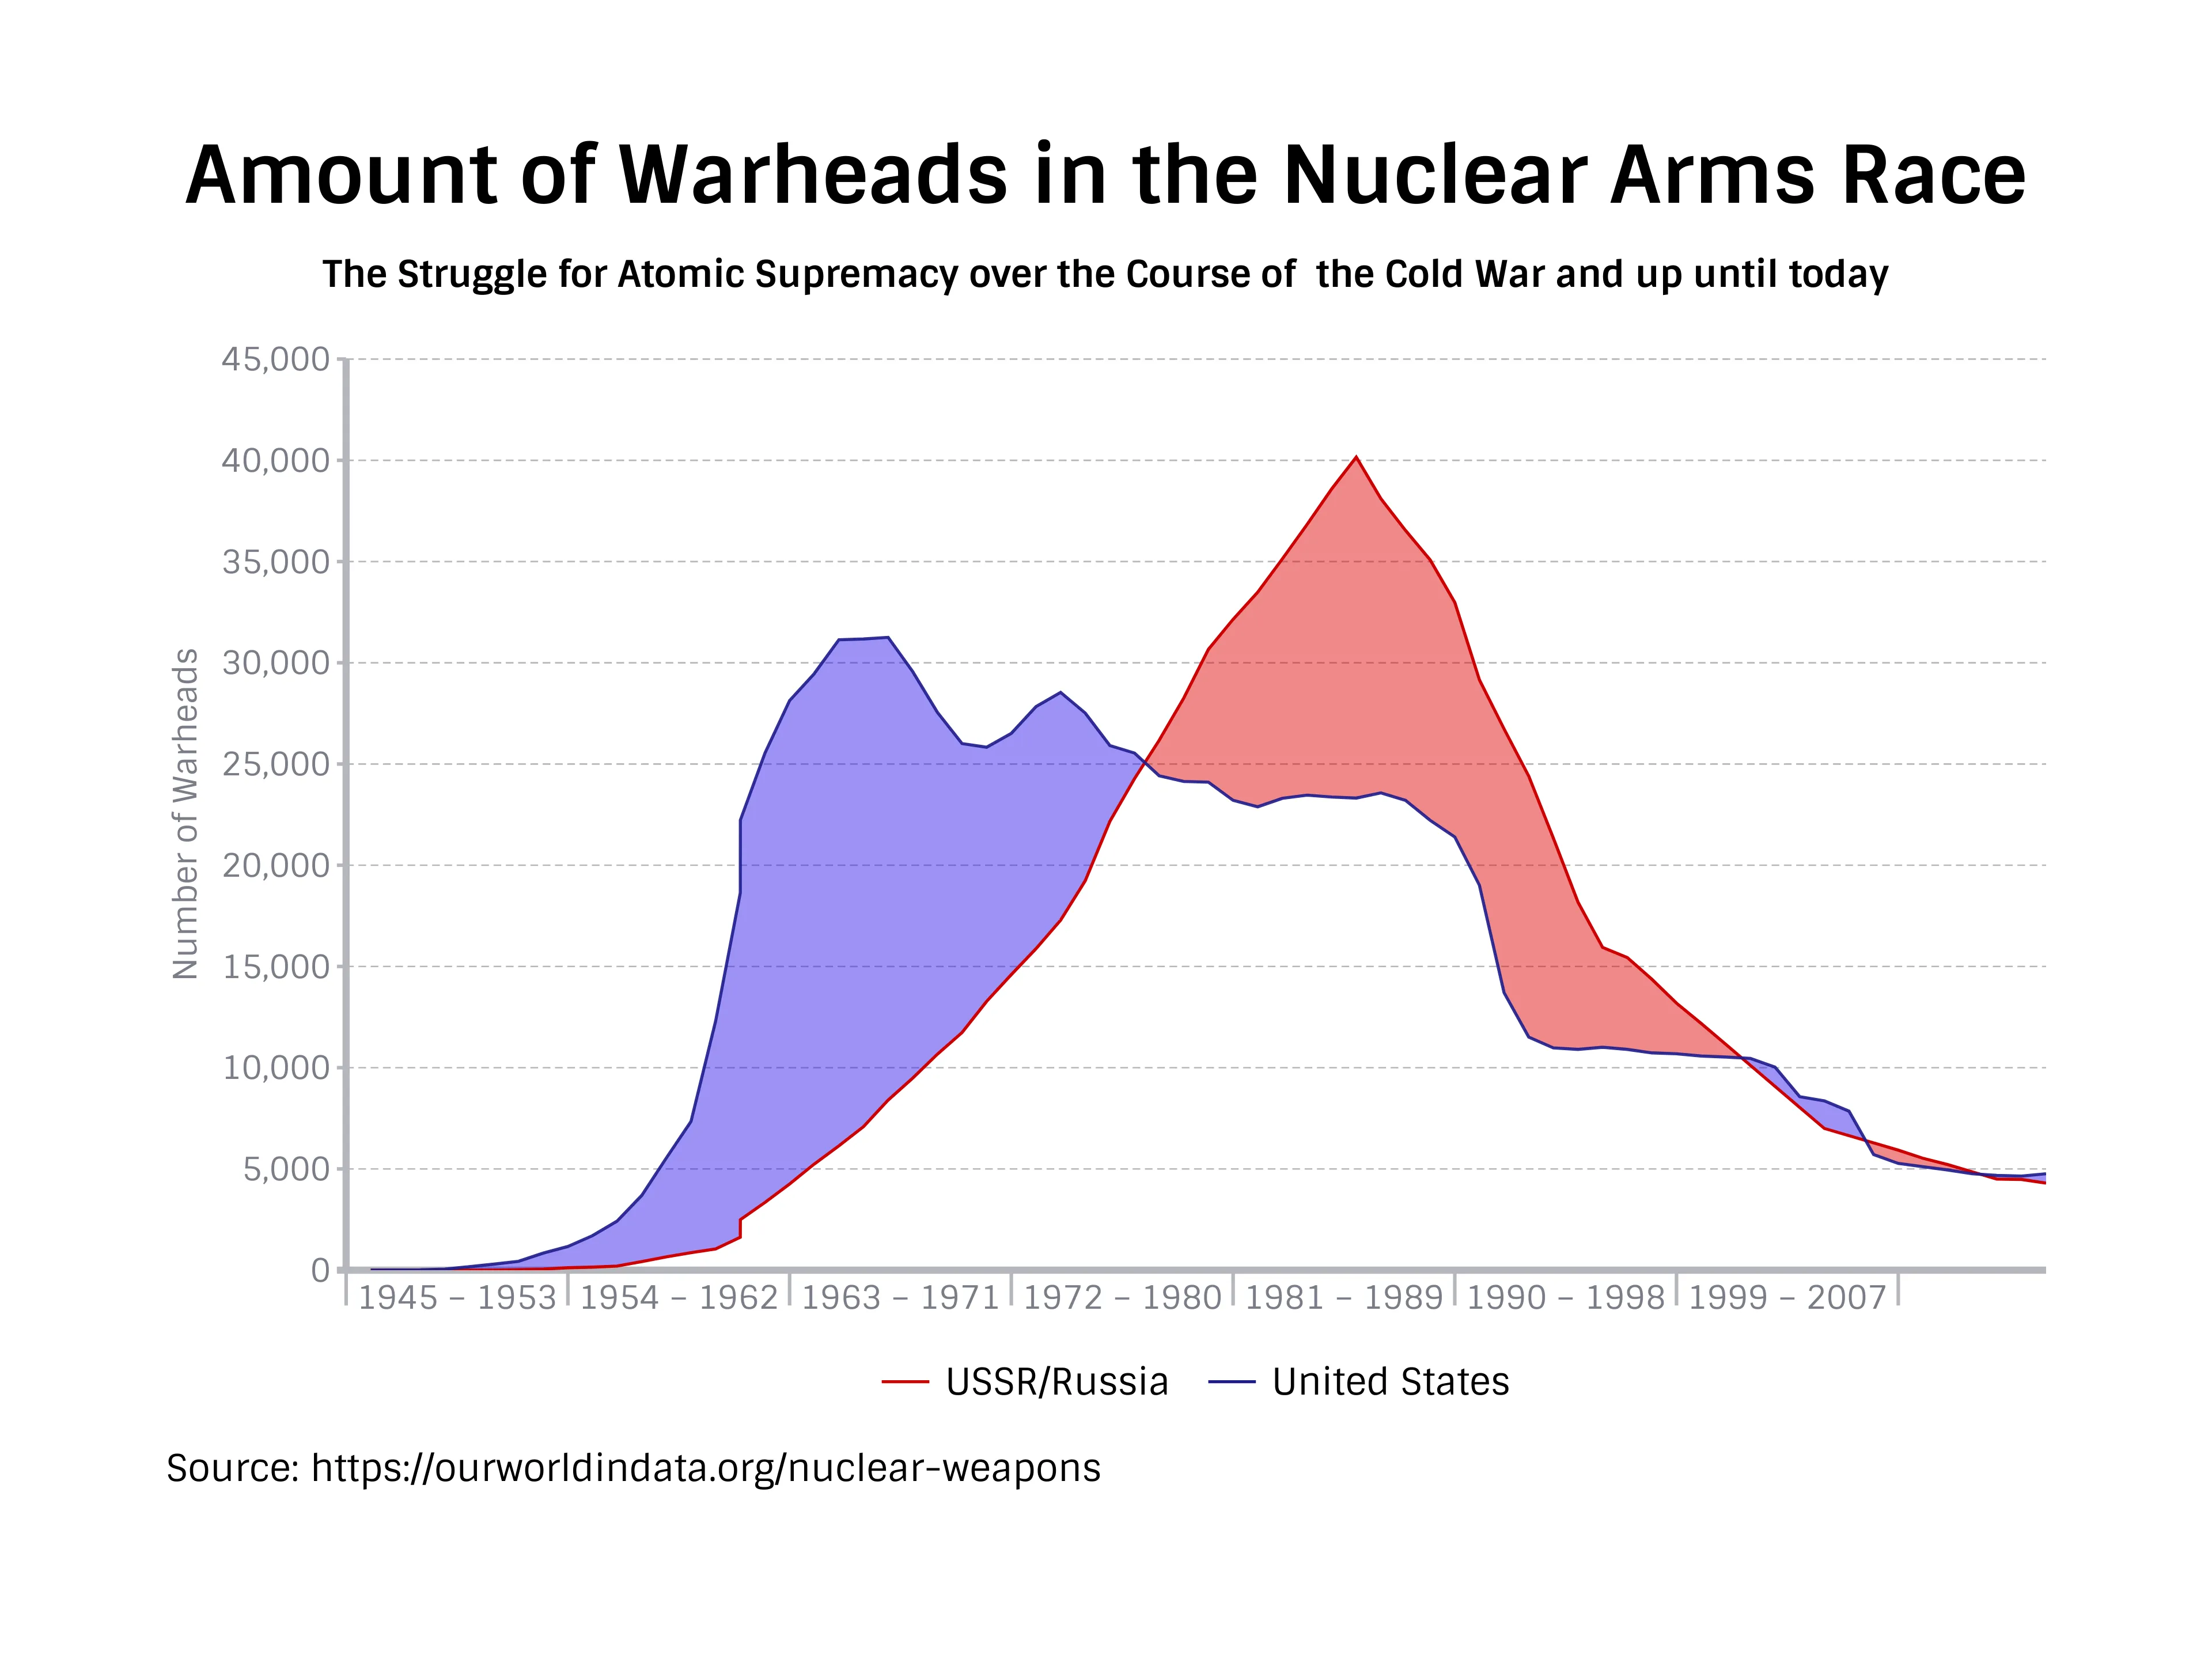
Vizzlo's AI-based chart generatorAmount of Warheads in the Nuclear Arms Race

On July 16, 1945, in a remote desert location near Alamogordo, New Mexico, the first atomic bomb was successfully detonated—the Trinity Test. On August 6, 1945, the United States dropped its first atomic bomb on the Japanese city of Hiroshima. The “Little Boy” exploded with about 13 kilotons of force, leveling five square miles of the city and killing 80,000 people instantly. Tens of thousands more would later die from radiation exposure.
Immediately after World War II the United States was the only country with nuclear weaponry. Within just a few years, however, the U.S.S.R. had caught up. On August 29, 1949, the Soviets tested their first nuclear bomb. The United States responded by launching a program in 1950 to develop more advanced thermonuclear weapons. The Cold War arms race had begun, and nuclear testing and research became a high-profile objective for several countries, especially the United States and the Soviet Union. in 1968The United States and Soviet Union took the lead in negotiating an international agreement to halt the further spread of nuclear weapons. The Treaty on the Non-Proliferation of Nuclear Weapons went into effect in 1970. It separated the world’s countries into two groups—nuclear weapons states and non-nuclear weapons states. Nuclear weapons states included the five countries that were known to possess nuclear weapons at the time—the United States, the U.S.S.R., Great Britain, France and China. According to the treaty, nuclear weapons states agreed not to use nuclear weapons or help non-nuclear states acquire nuclear weapons. They also agreed to gradually reduce their stockpiles of nuclear weapons with the eventual goal of total disarmament. With President Trump pulling out of the disarmament agreement with Russia last year and Countries like Pakistan, Iran and North Korea developing nuclear weapons, a new arms race might be on the horizon.

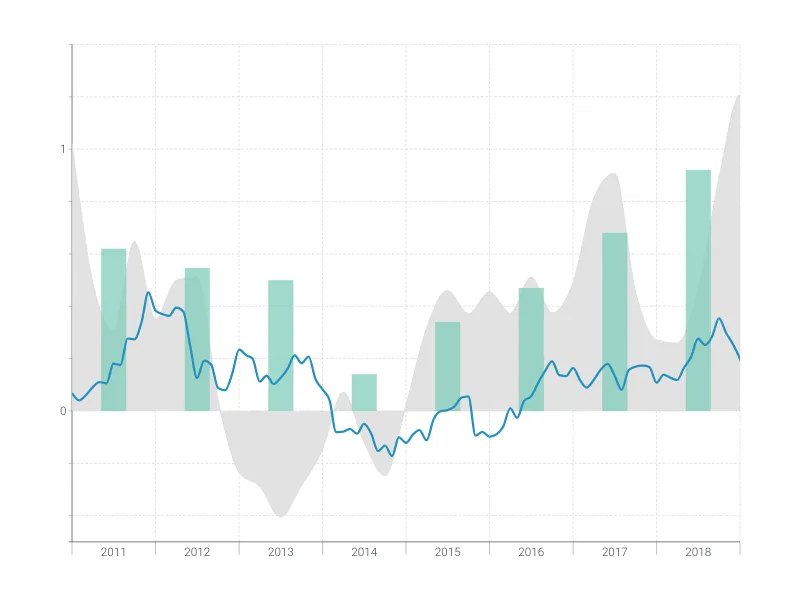
This is an example of Vizzlo's “Time Series Graph”
Complex time series graph to visualize detailed financial data.
Finance & Economics Bar & Column charts Line & Area charts Time-based charts