Chart Vizzard
Vizzlo's AI-based chart generatorApple strives to get to a more balanced revenue mix

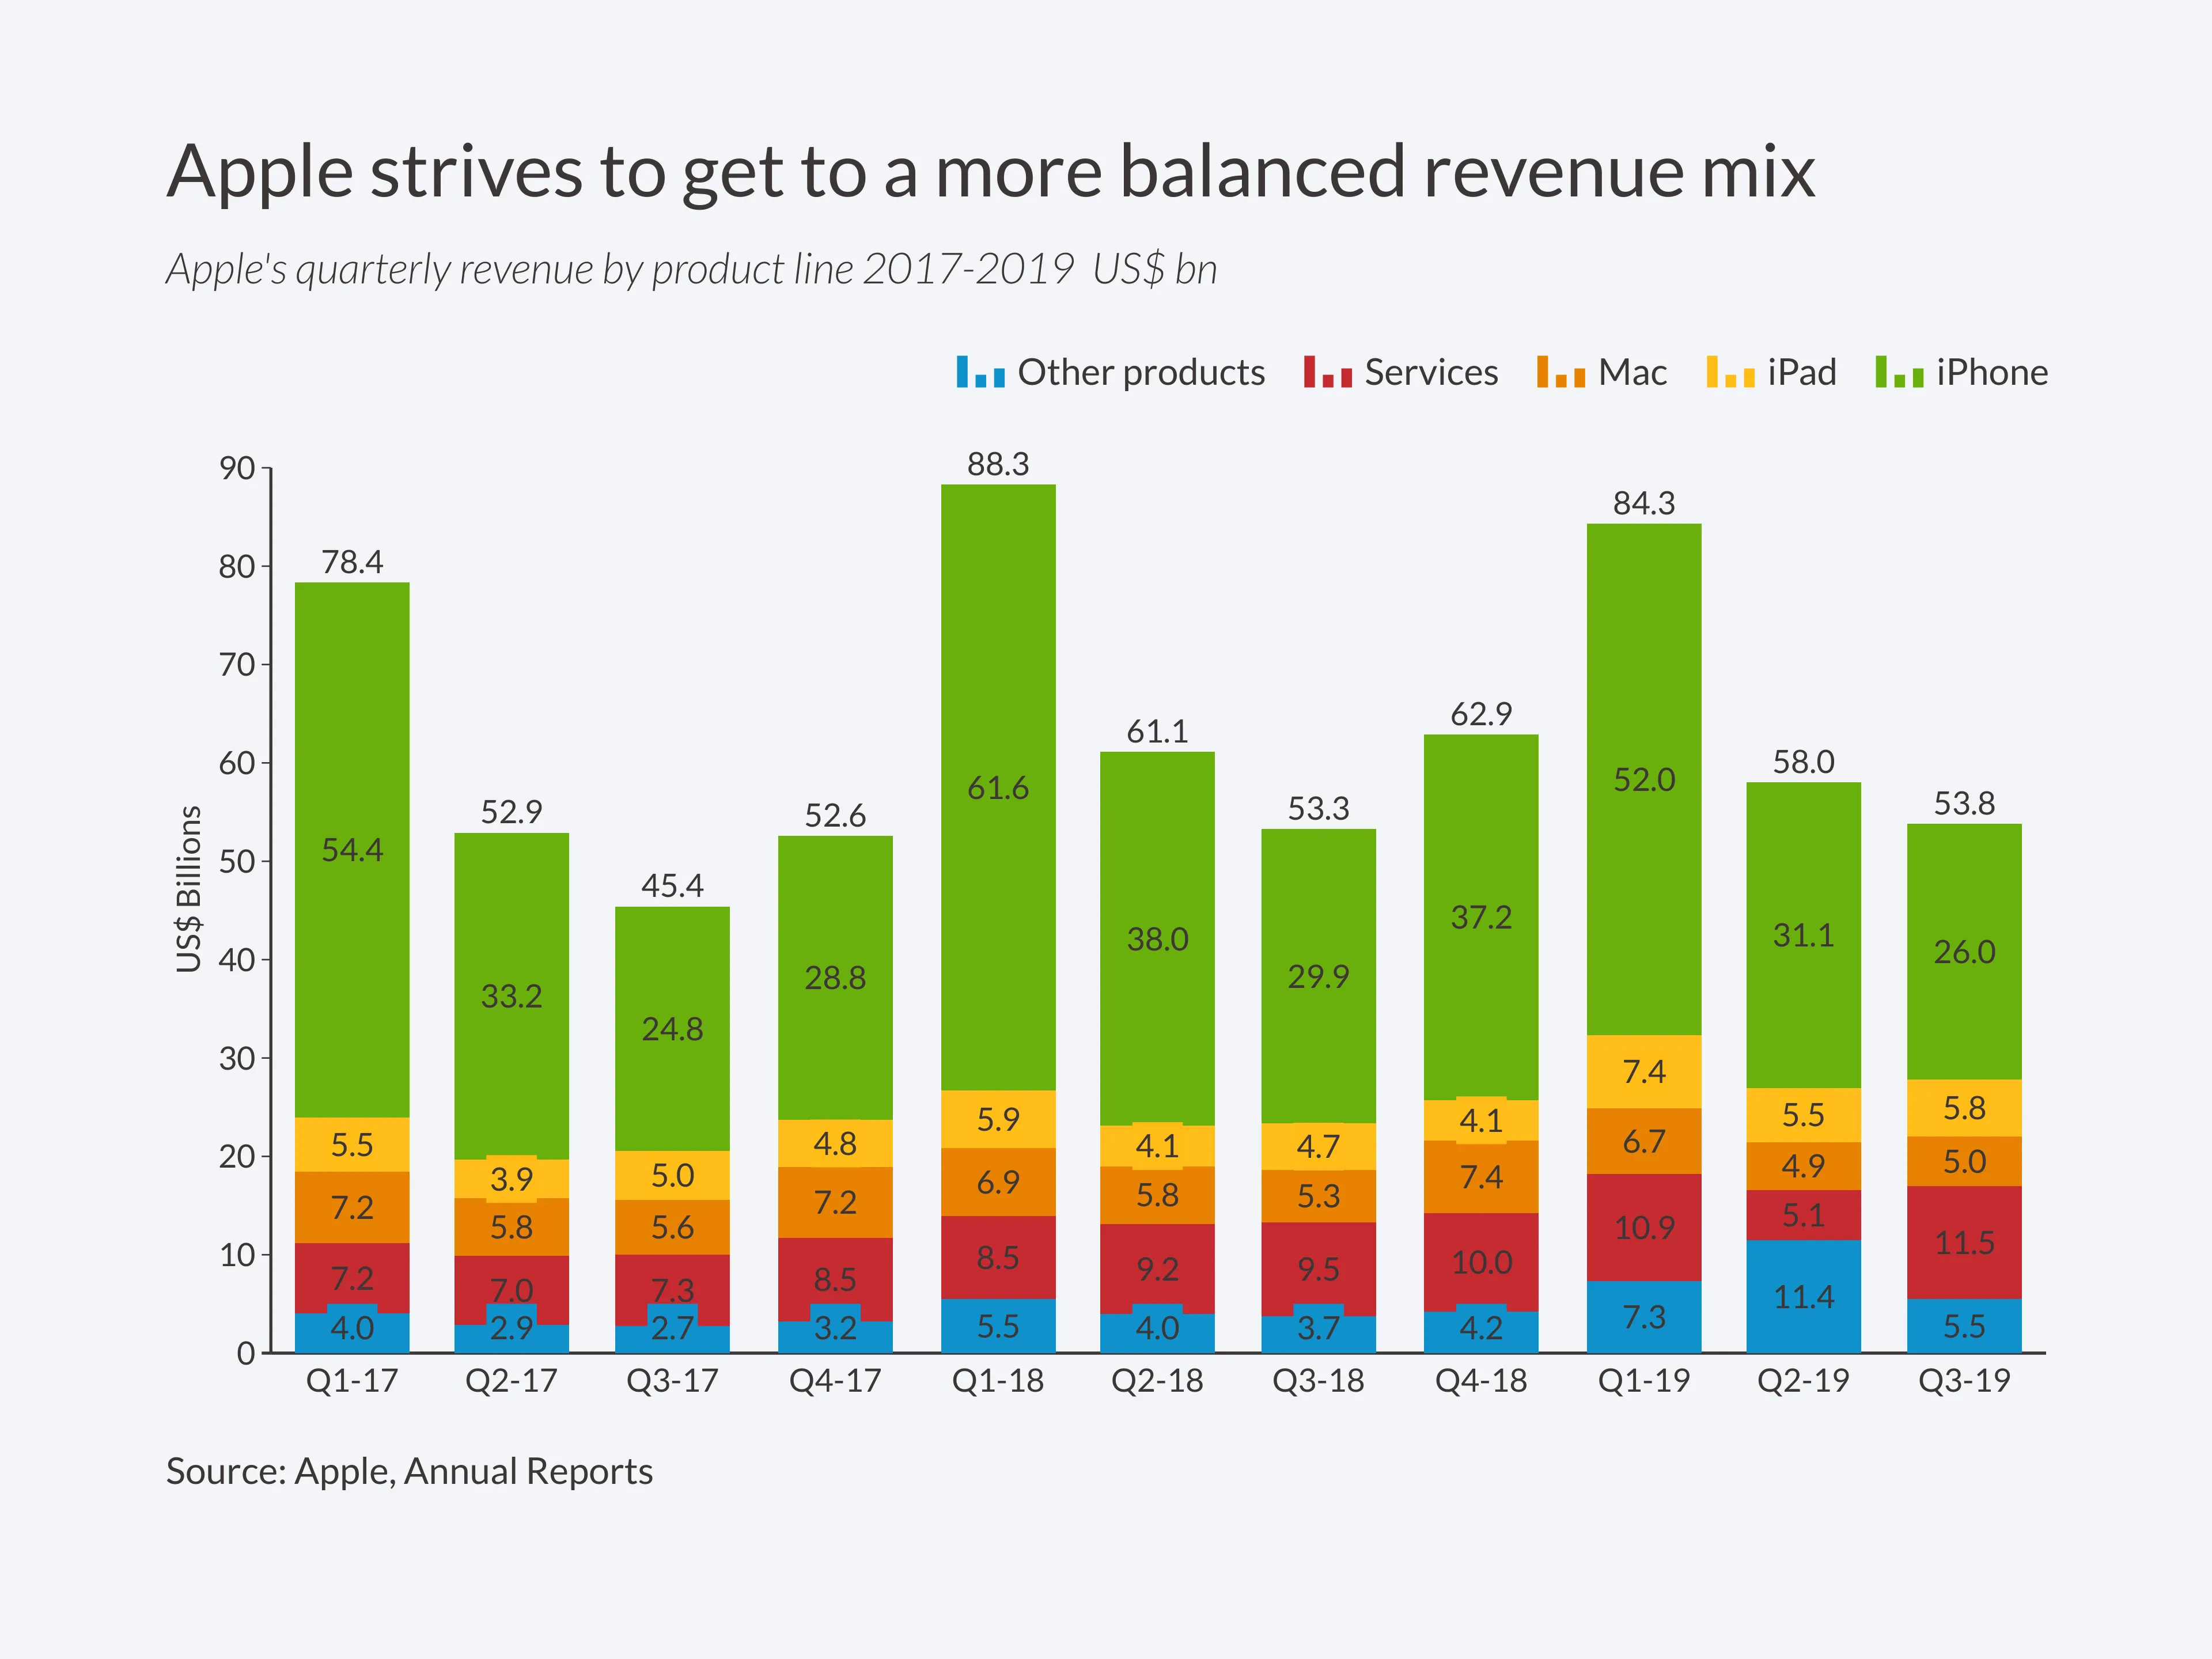
With Apple launching their new iPhone 11 lineup on September 10th, we can anticipate the newest model hitting stores as soon as September 20th. In the fiscal report for the third quarter, Apple is reporting $53.8 billion in revenue which corresponds to an increase of about 1% from Q3 2018 and a decrease of around 7% from its fiscal second quarter this year. However, the iPhone is still the biggest source of Apple’s income and it is expected to affect a revenue increase of over $10 billion, to $64 billion, by next quarter. Although Apple’s profits mainly derive from the sales of the iPhone, the iPad is the second biggest part of Apple’s net sales with around $5.5 billion generated in revenue while Mac generated $4.9 billion in the fiscal 2019 third quarter.

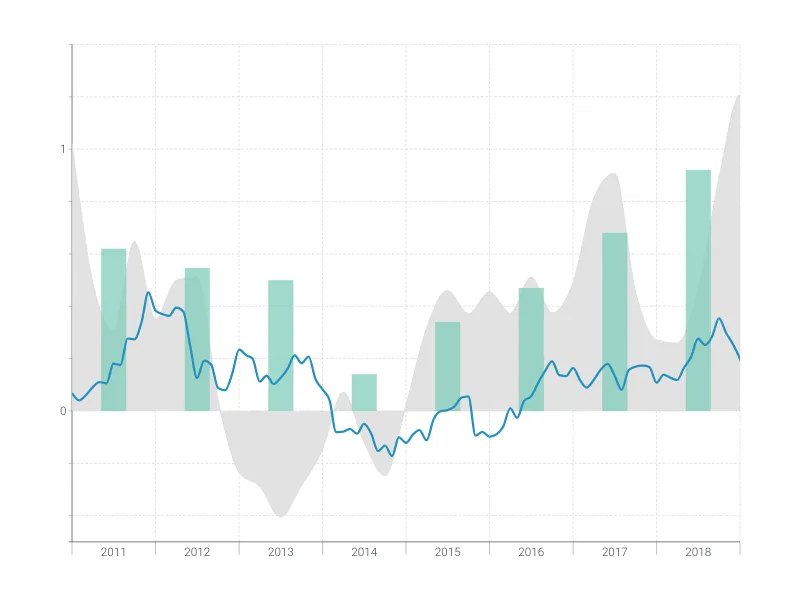
This is an example of Vizzlo's “Time Series Graph”
Complex time series graph to visualize detailed financial data.
Finance & Economics Bar & Column charts Line & Area charts Time-based charts