Chart Vizzard
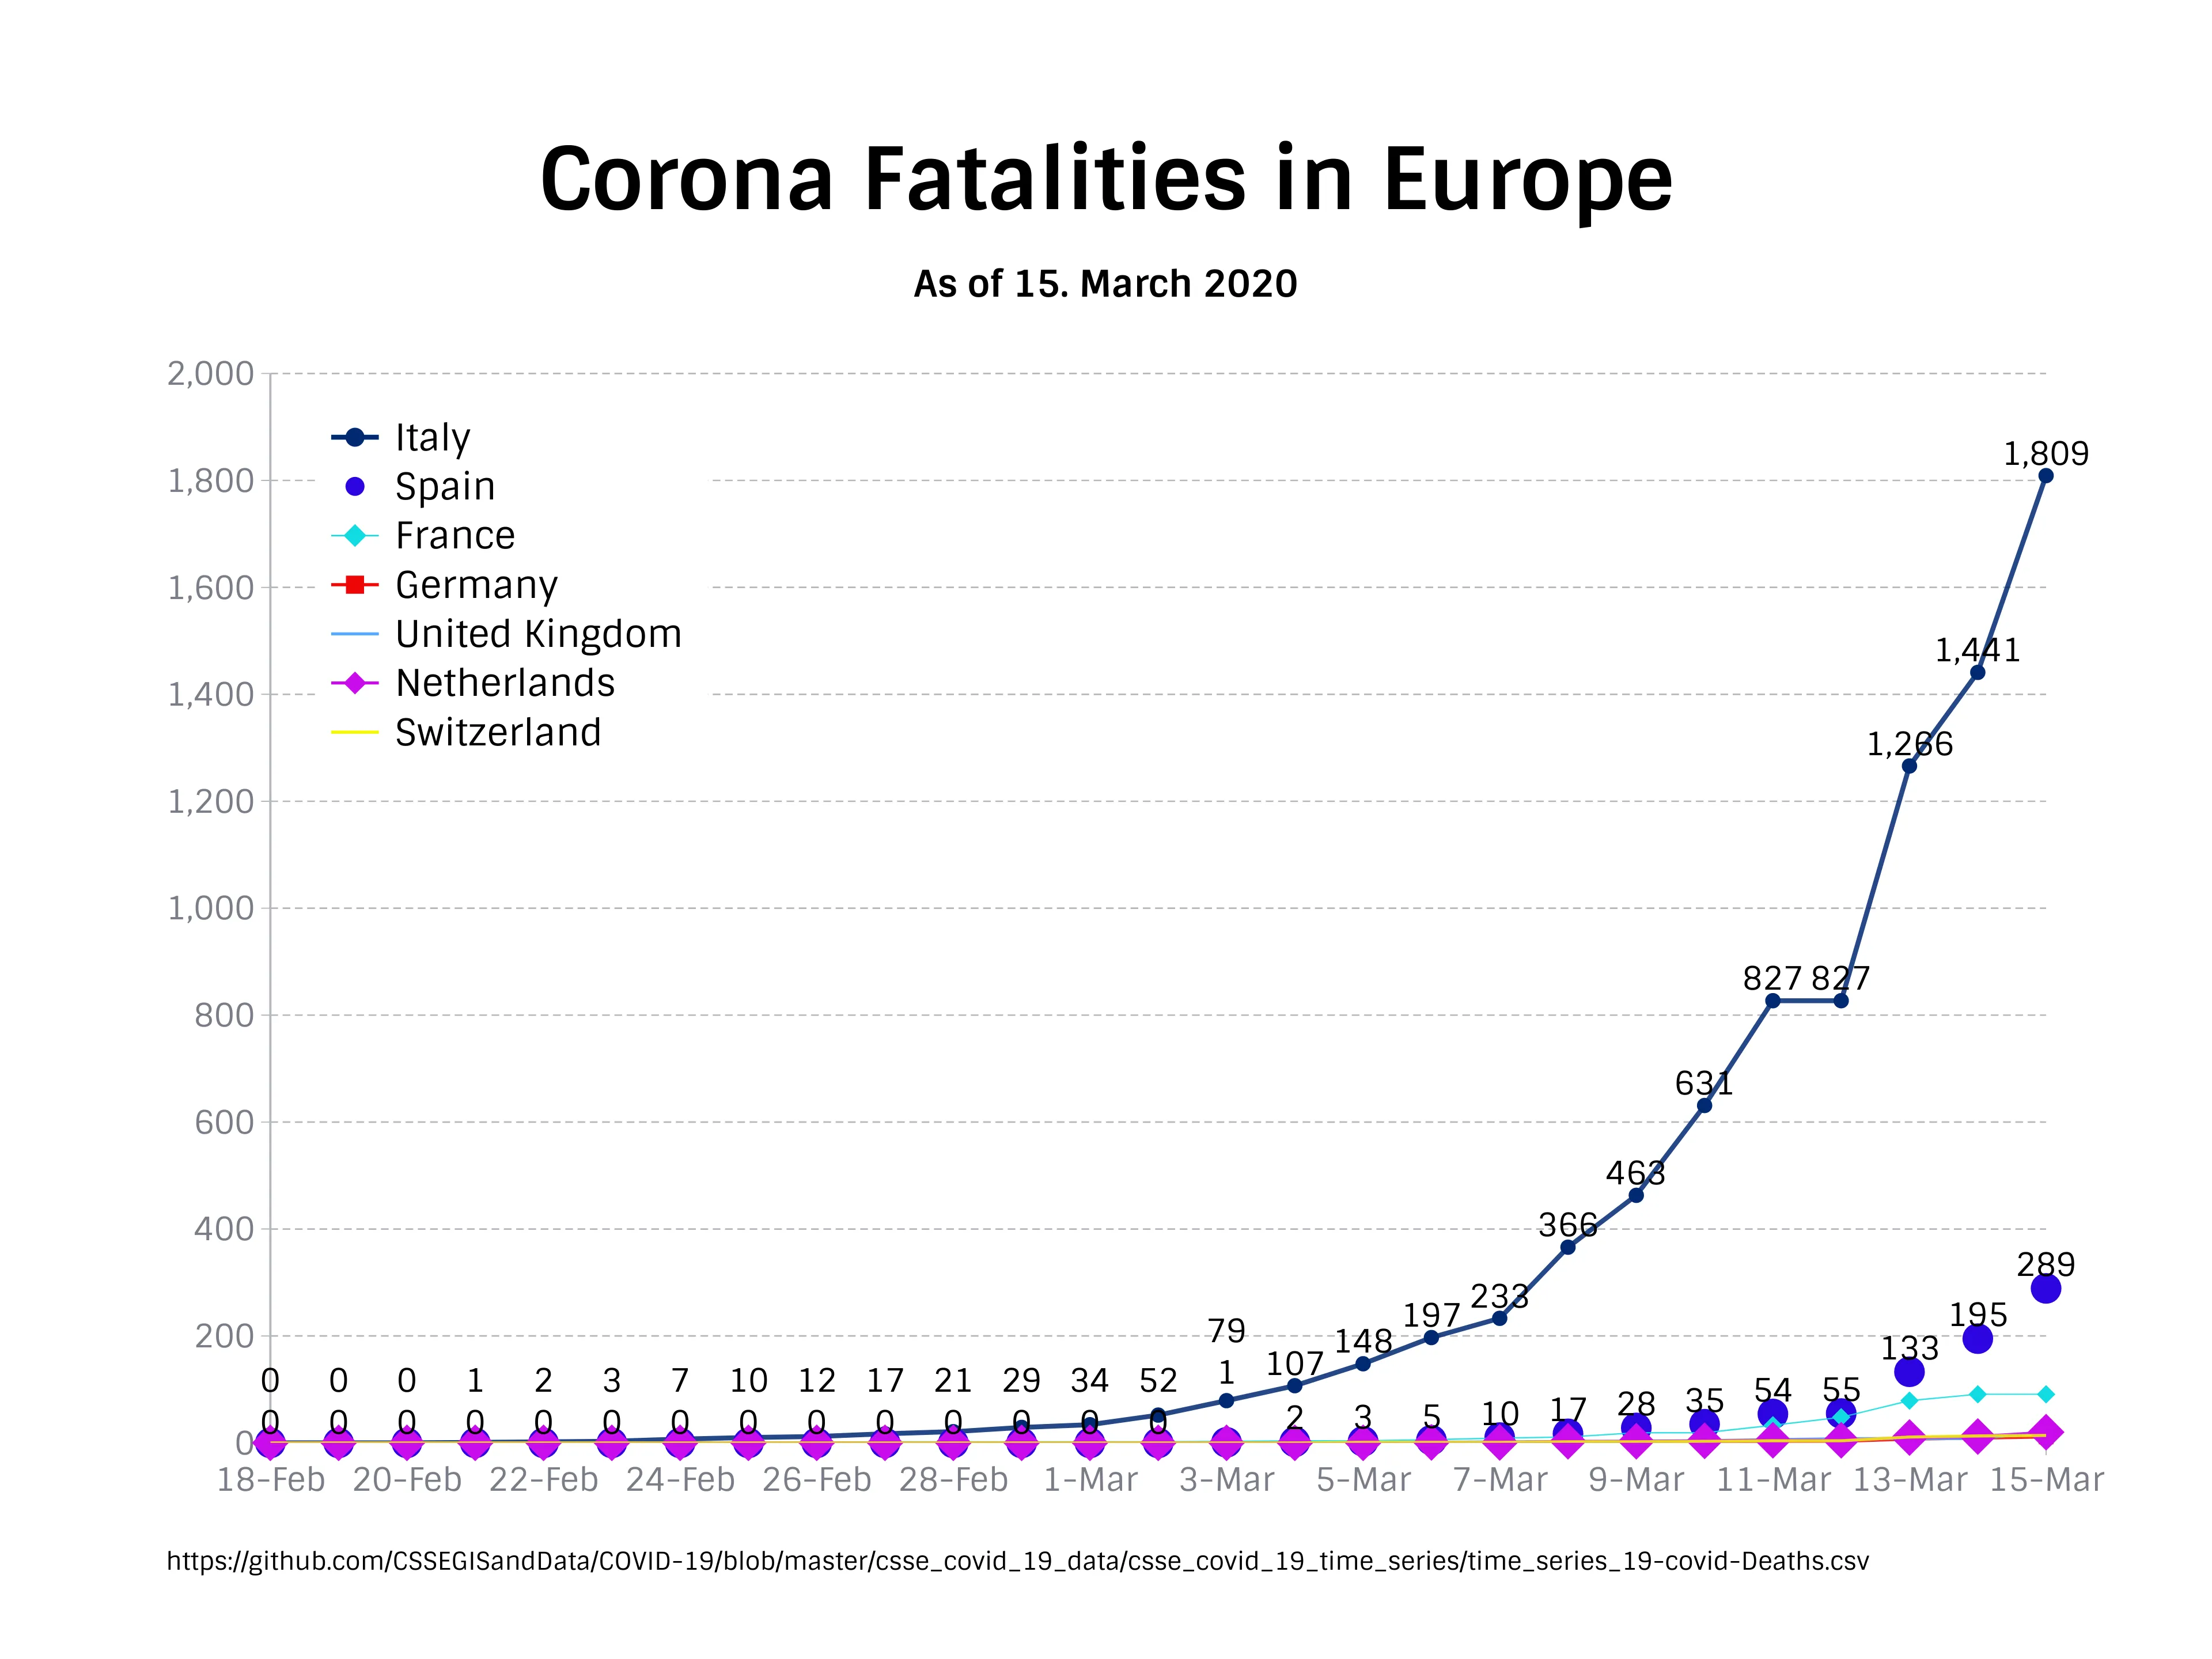
Vizzlo's AI-based chart generatorCorona Fatalities in Europe

With Italys fatalities now fast approaching the 2000 mark, and cases with a deathly outcome close to 300 in Spain, the south of Europe has been hit hard by the COVID 19 crisis.
While it is too early to judge anything, the center and north of Europe seem to look stable at the moment with most central European countries hovering between the 10 and 20 mark for now.
As of now these numbers don’t mean much, with open cases rising and widespread testing not readily available in large quantities. However the responses by companies, governments and the populous might give hope that the spread can be contained somewhat.
Wherever in the world you might be, be sure to stay safe, wash your hands and sanitize and try to not feed into the ever spreading paranoia such as panic buying, which will inevitably make life worse for everyone and especially the groups most at risk.

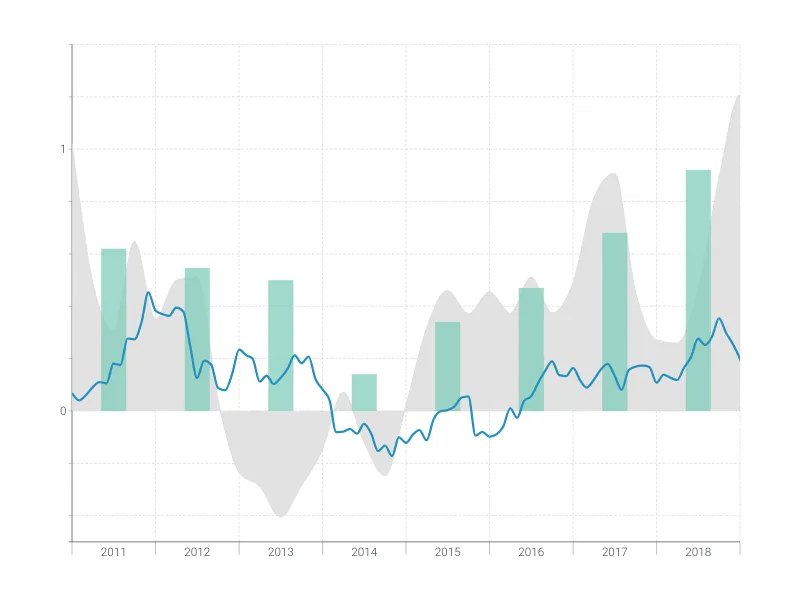
This is an example of Vizzlo's “Time Series Graph”
Complex time series graph to visualize detailed financial data.
Finance & Economics Bar & Column charts Line & Area charts Time-based charts