Chart Vizzard
Vizzlo's AI-based chart generatorEnduring Solitude

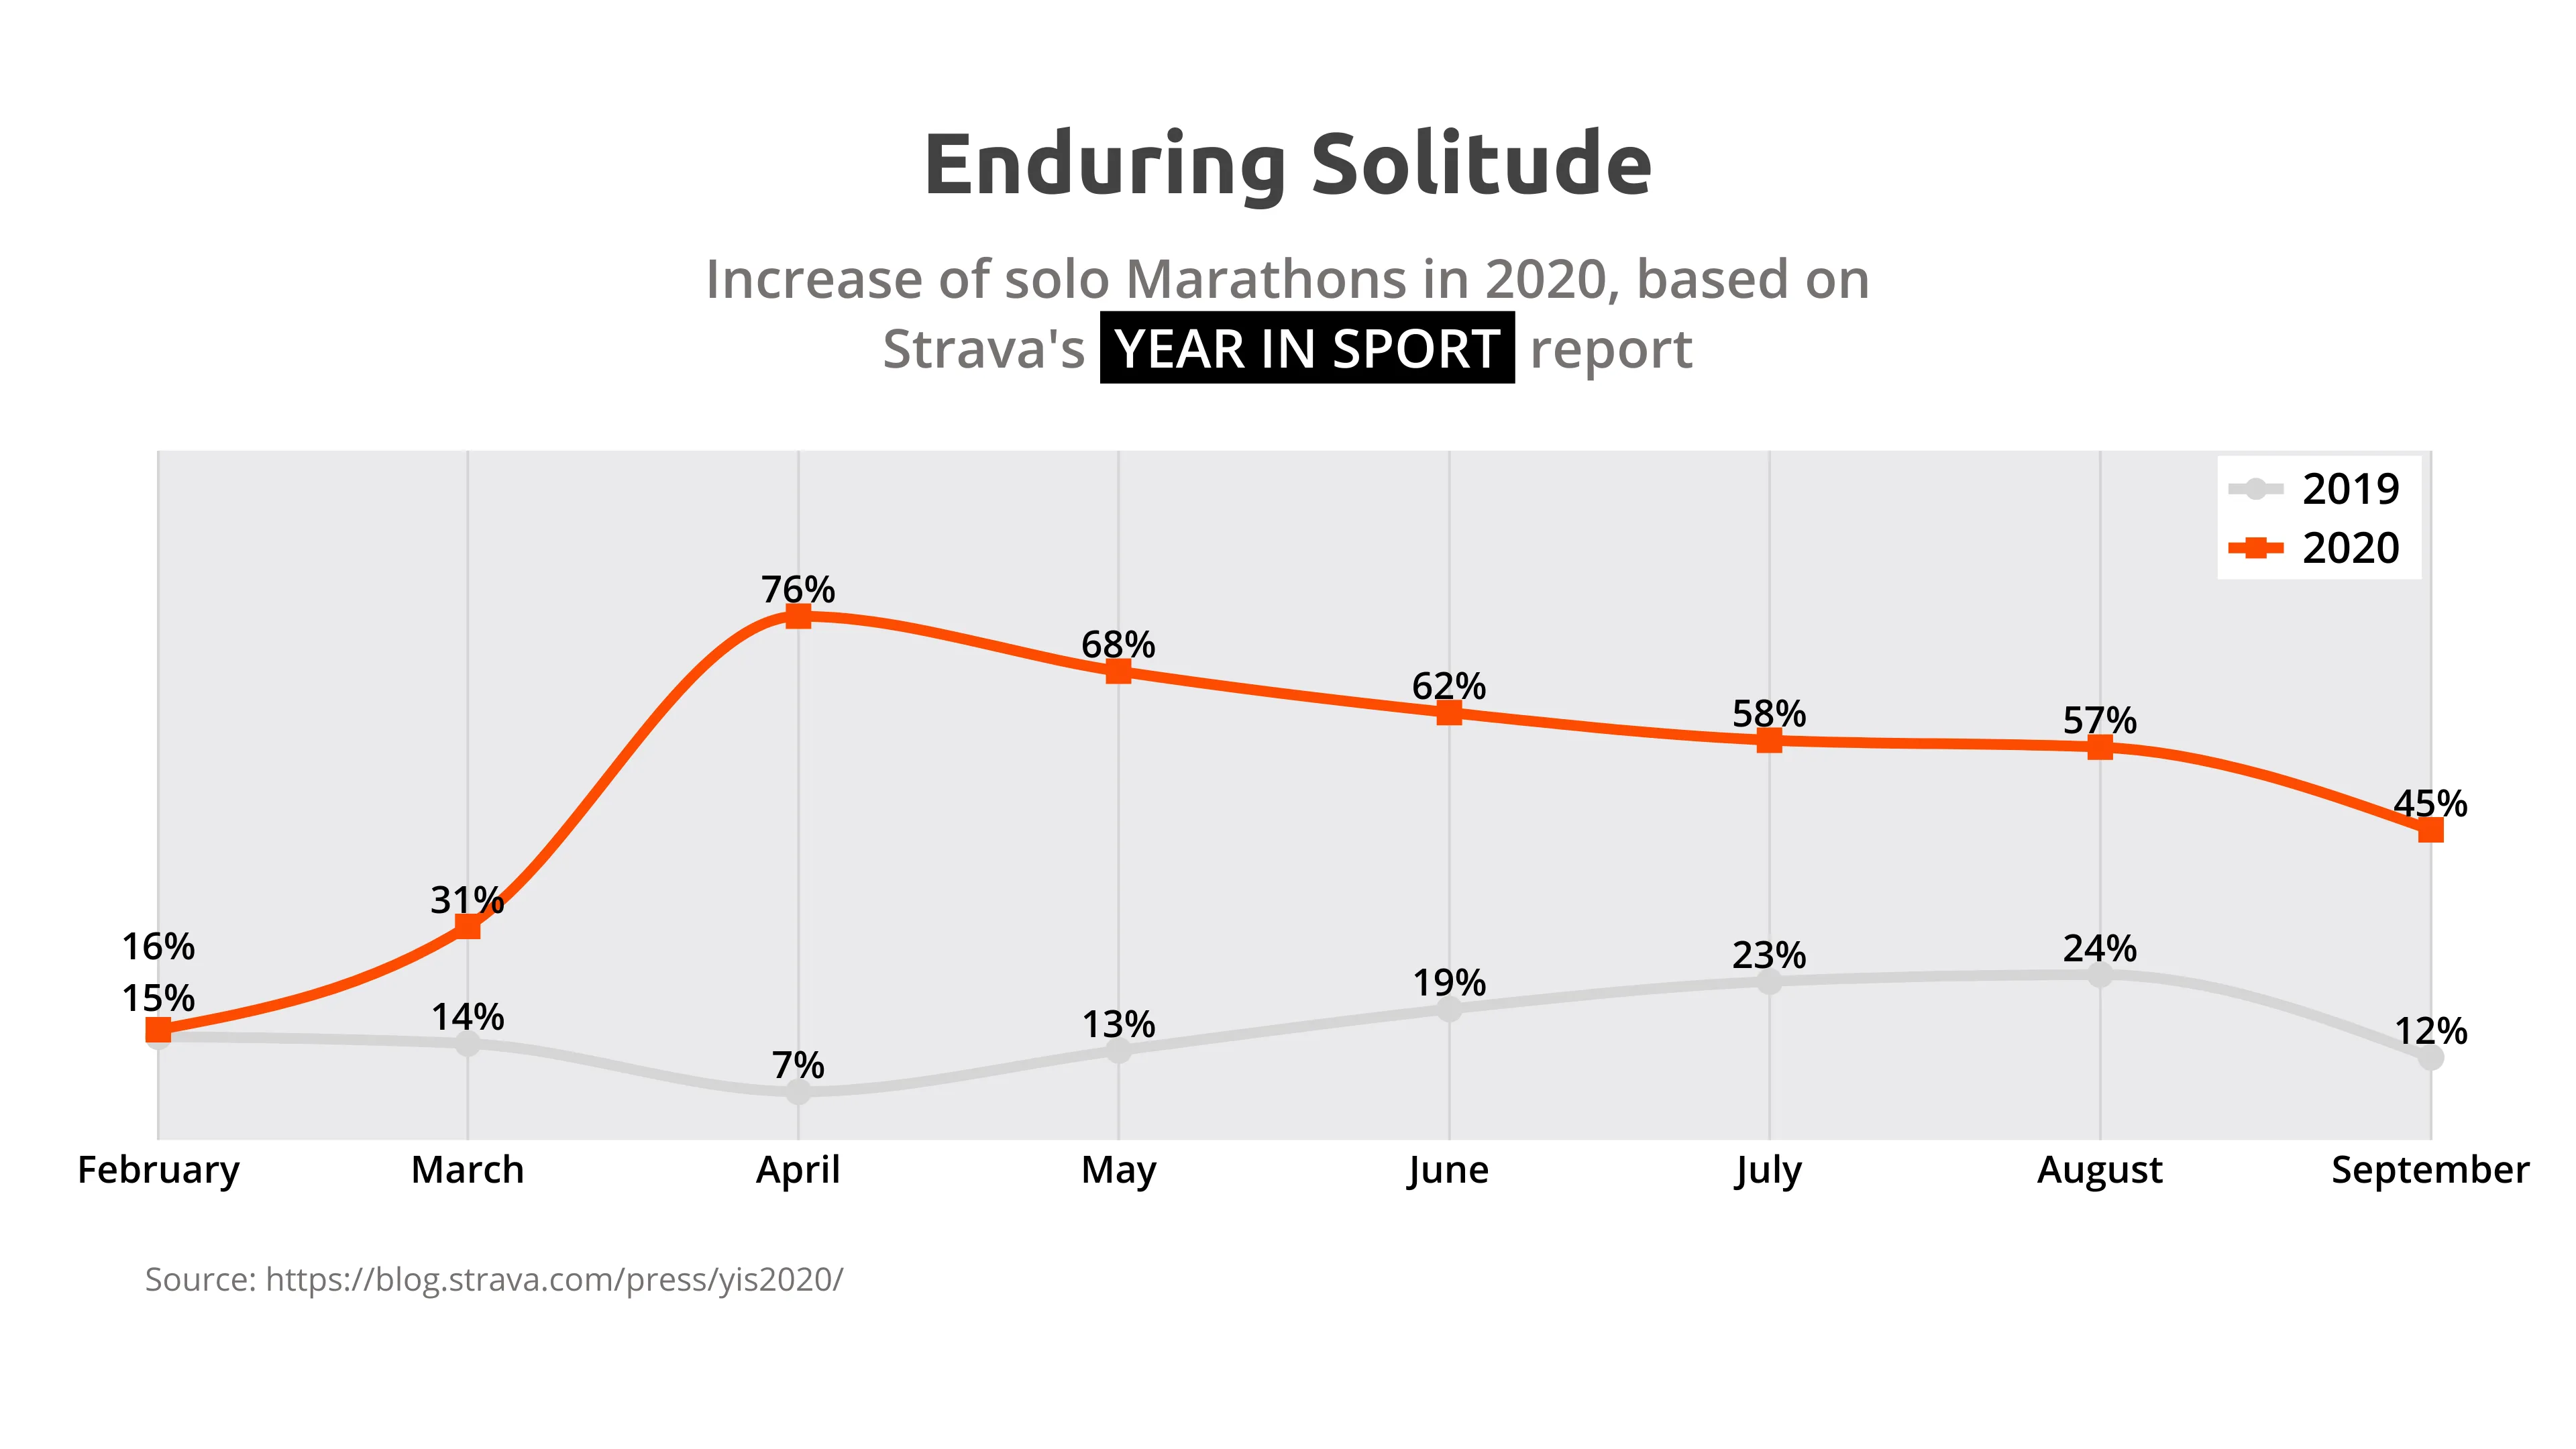
2020 was the year of loneliness for many people in the world and Strava has the data to back up this claim.
According to the current “Year in Sport” report, 76% of all Marathons which were recorded on the platform have been run in solitude—a tremendous jump up from 7% in the same month the year before.
But we can also see, that, towards the end of the year, the situation starts to normalize a bit. So, even if 2021 might again be special for most athletes, next year we will hopefully be able to bathe in each other’s sweat when celebrating our running achievements.

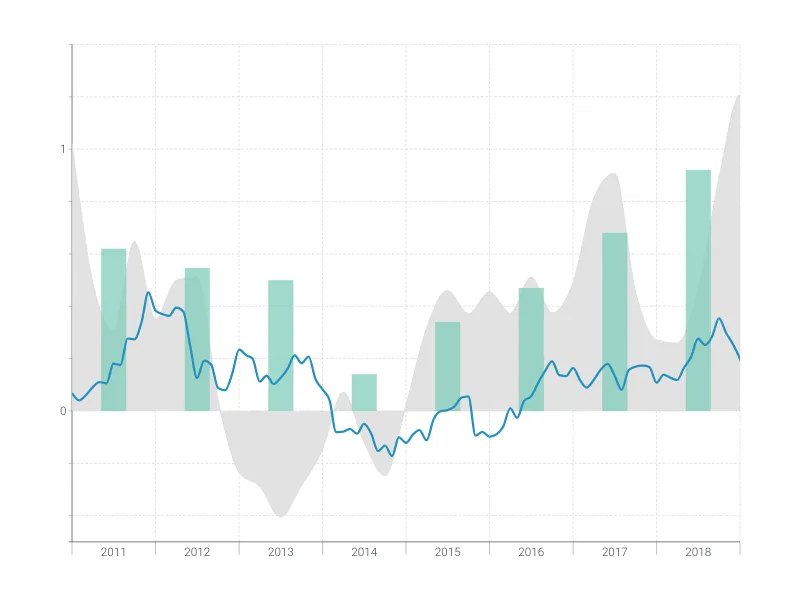
This is an example of Vizzlo's “Time Series Graph”
Complex time series graph to visualize detailed financial data.
Finance & Economics Bar & Column charts Line & Area charts Time-based charts