Chart Vizzard
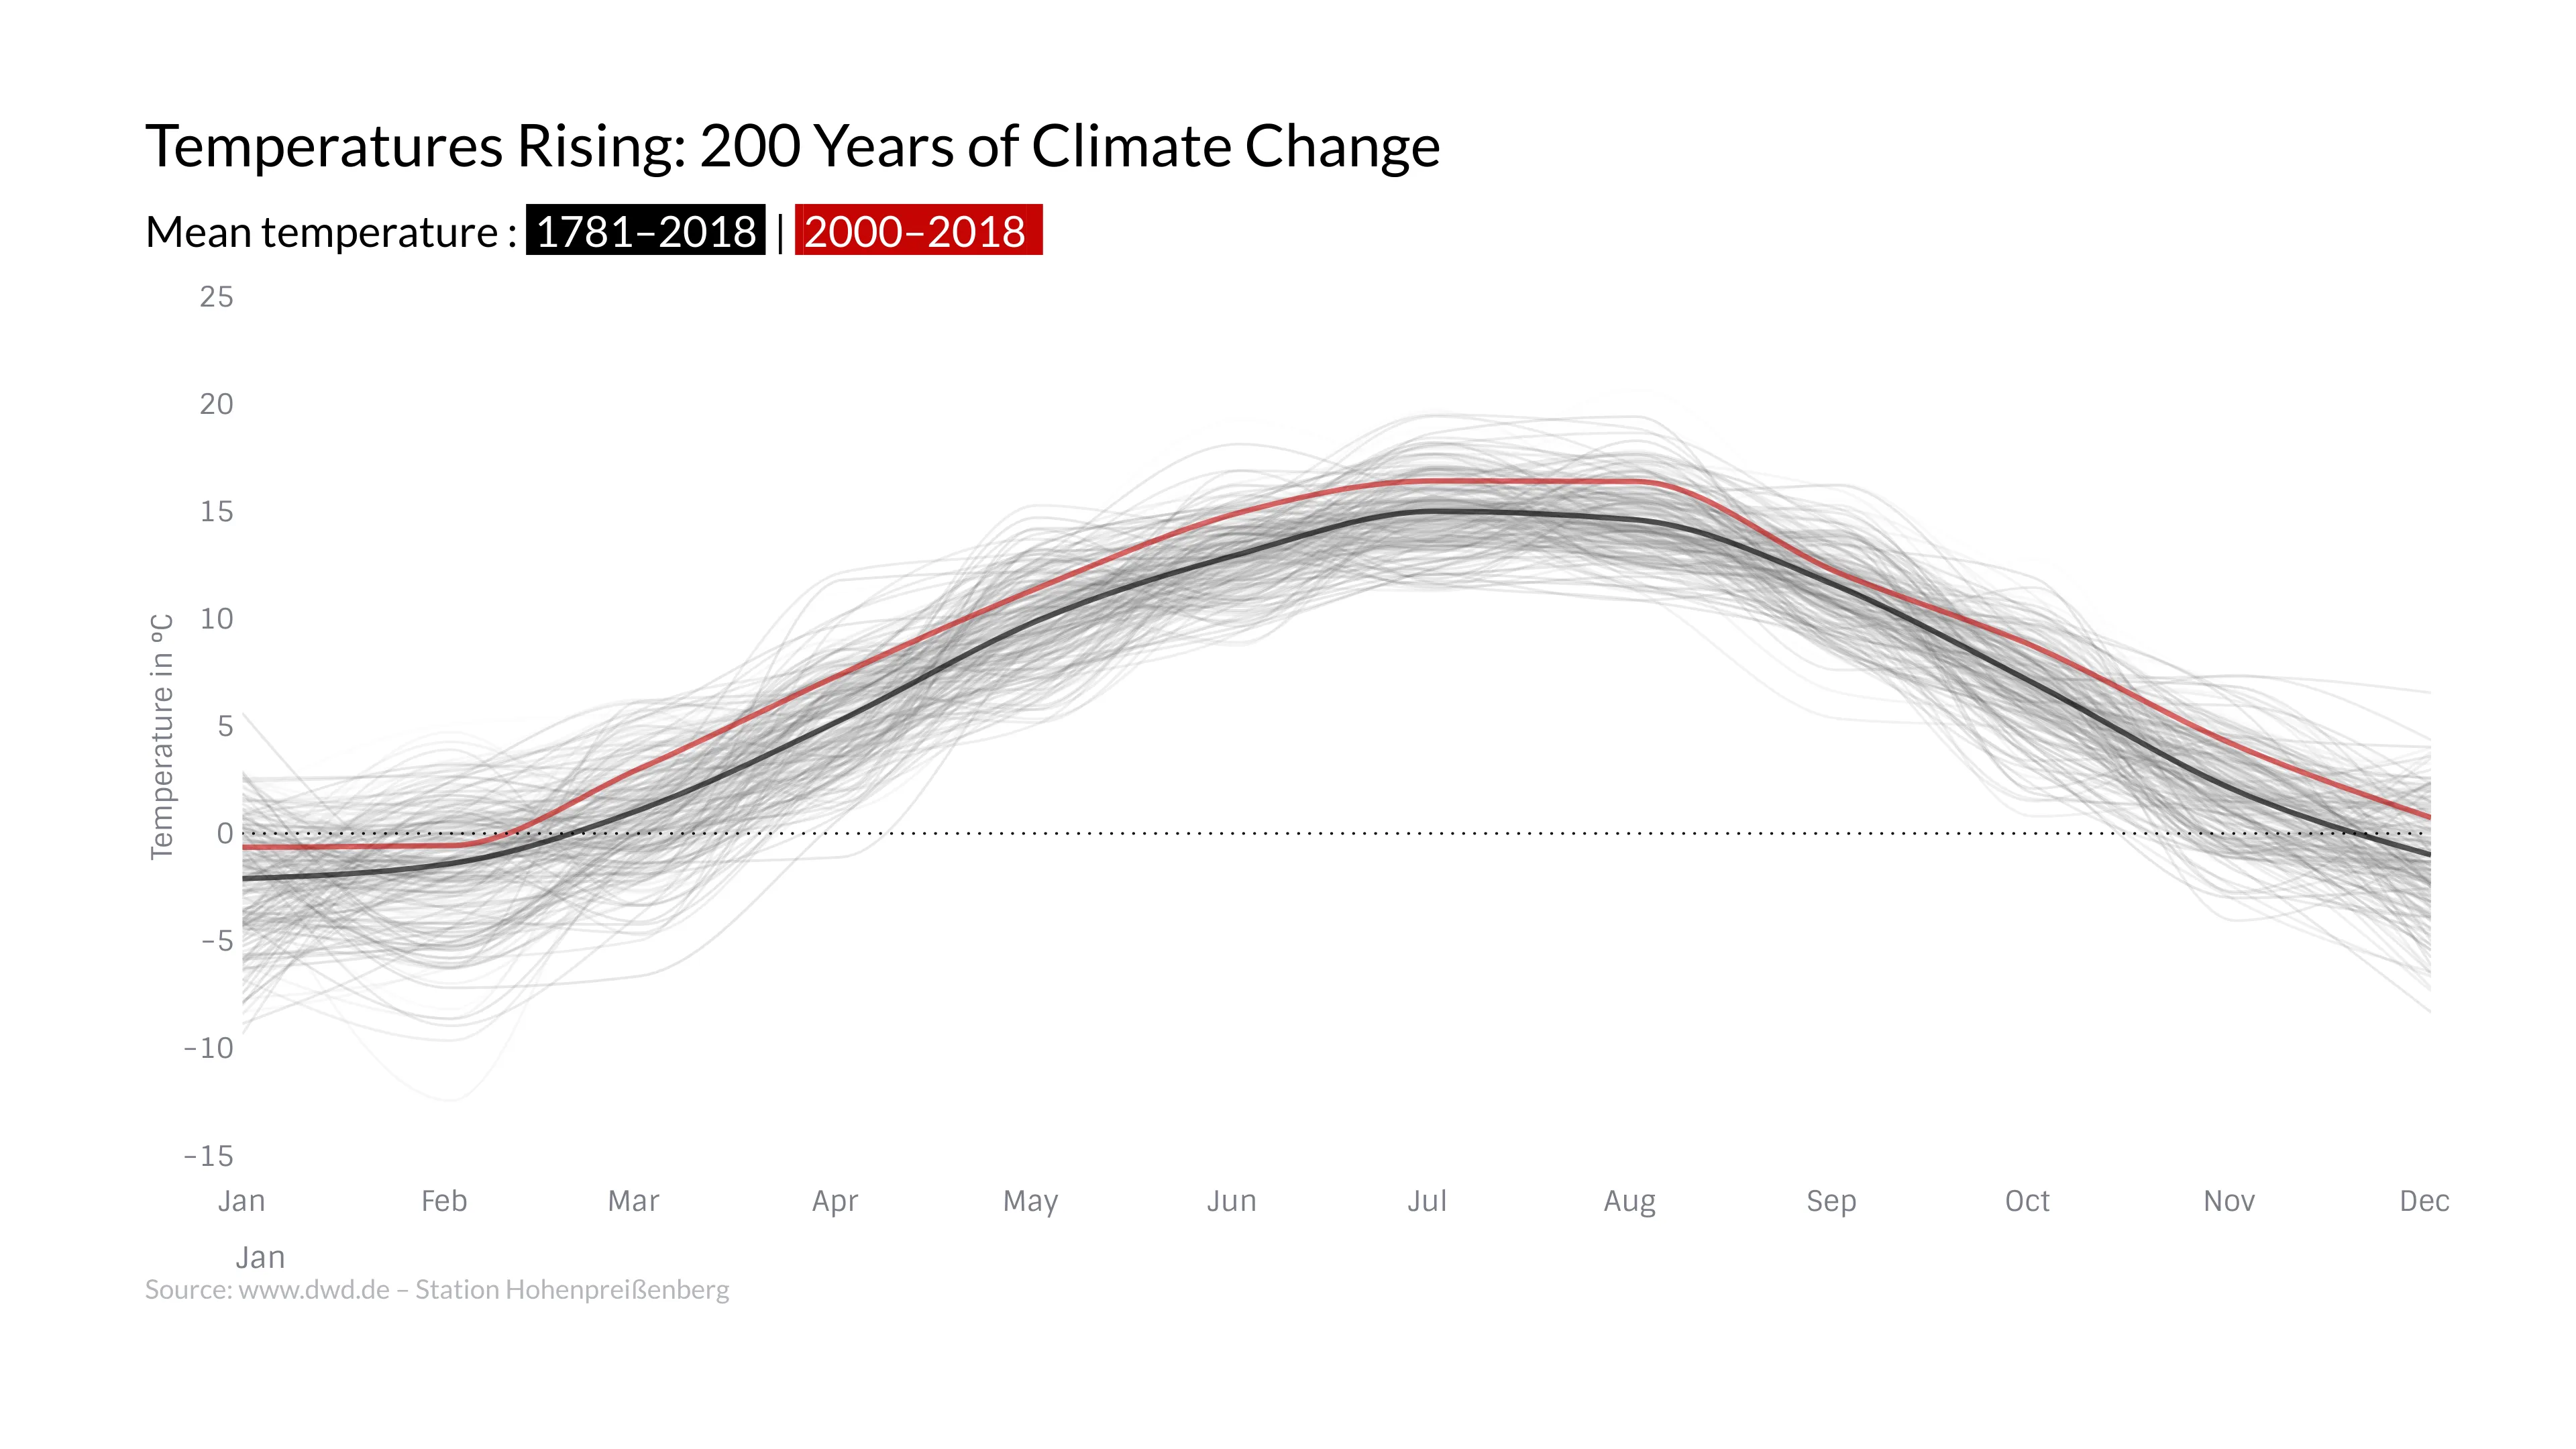
Vizzlo's AI-based chart generatorTemperatures Rising: 200 Years of Climate Change

The meteorological observatory at Hohenpreißenberg is the oldest weather station on a mountain, with some data sets reaching back until 1753, when Monks from a nearby monastery started to measure and collect weather data. As of today, the observatory is an Institution of the German Meteorological Service (Deutscher Wetterdienst) and part of the Global Atmosphere Watch. The Data of Hohenpreißenberg is not only important because of the longevity of the records, but also because the measurements are unobstructed by changing infrastructure in the surroundings, which is fairly uncommon. This chart plots the data of monthly average temperatures from 1781 onward until today. The black line shows the average temperature since 1781, and red line shows the average from the last eighteen years. The significant gap between the two would suggest that a rise in temperature is indeed taking place.

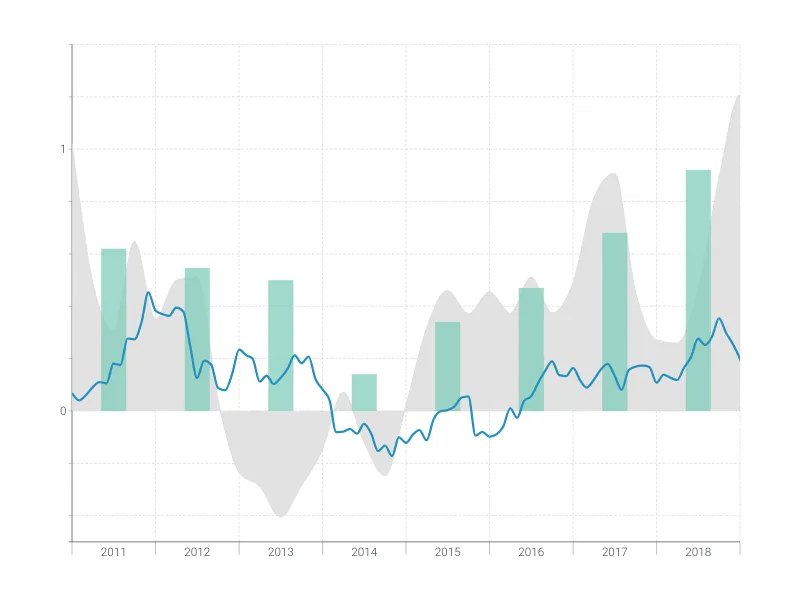
This is an example of Vizzlo's “Time Series Graph”
Complex time series graph to visualize detailed financial data.
Finance & Economics Bar & Column charts Line & Area charts Time-based charts