Chart Vizzard
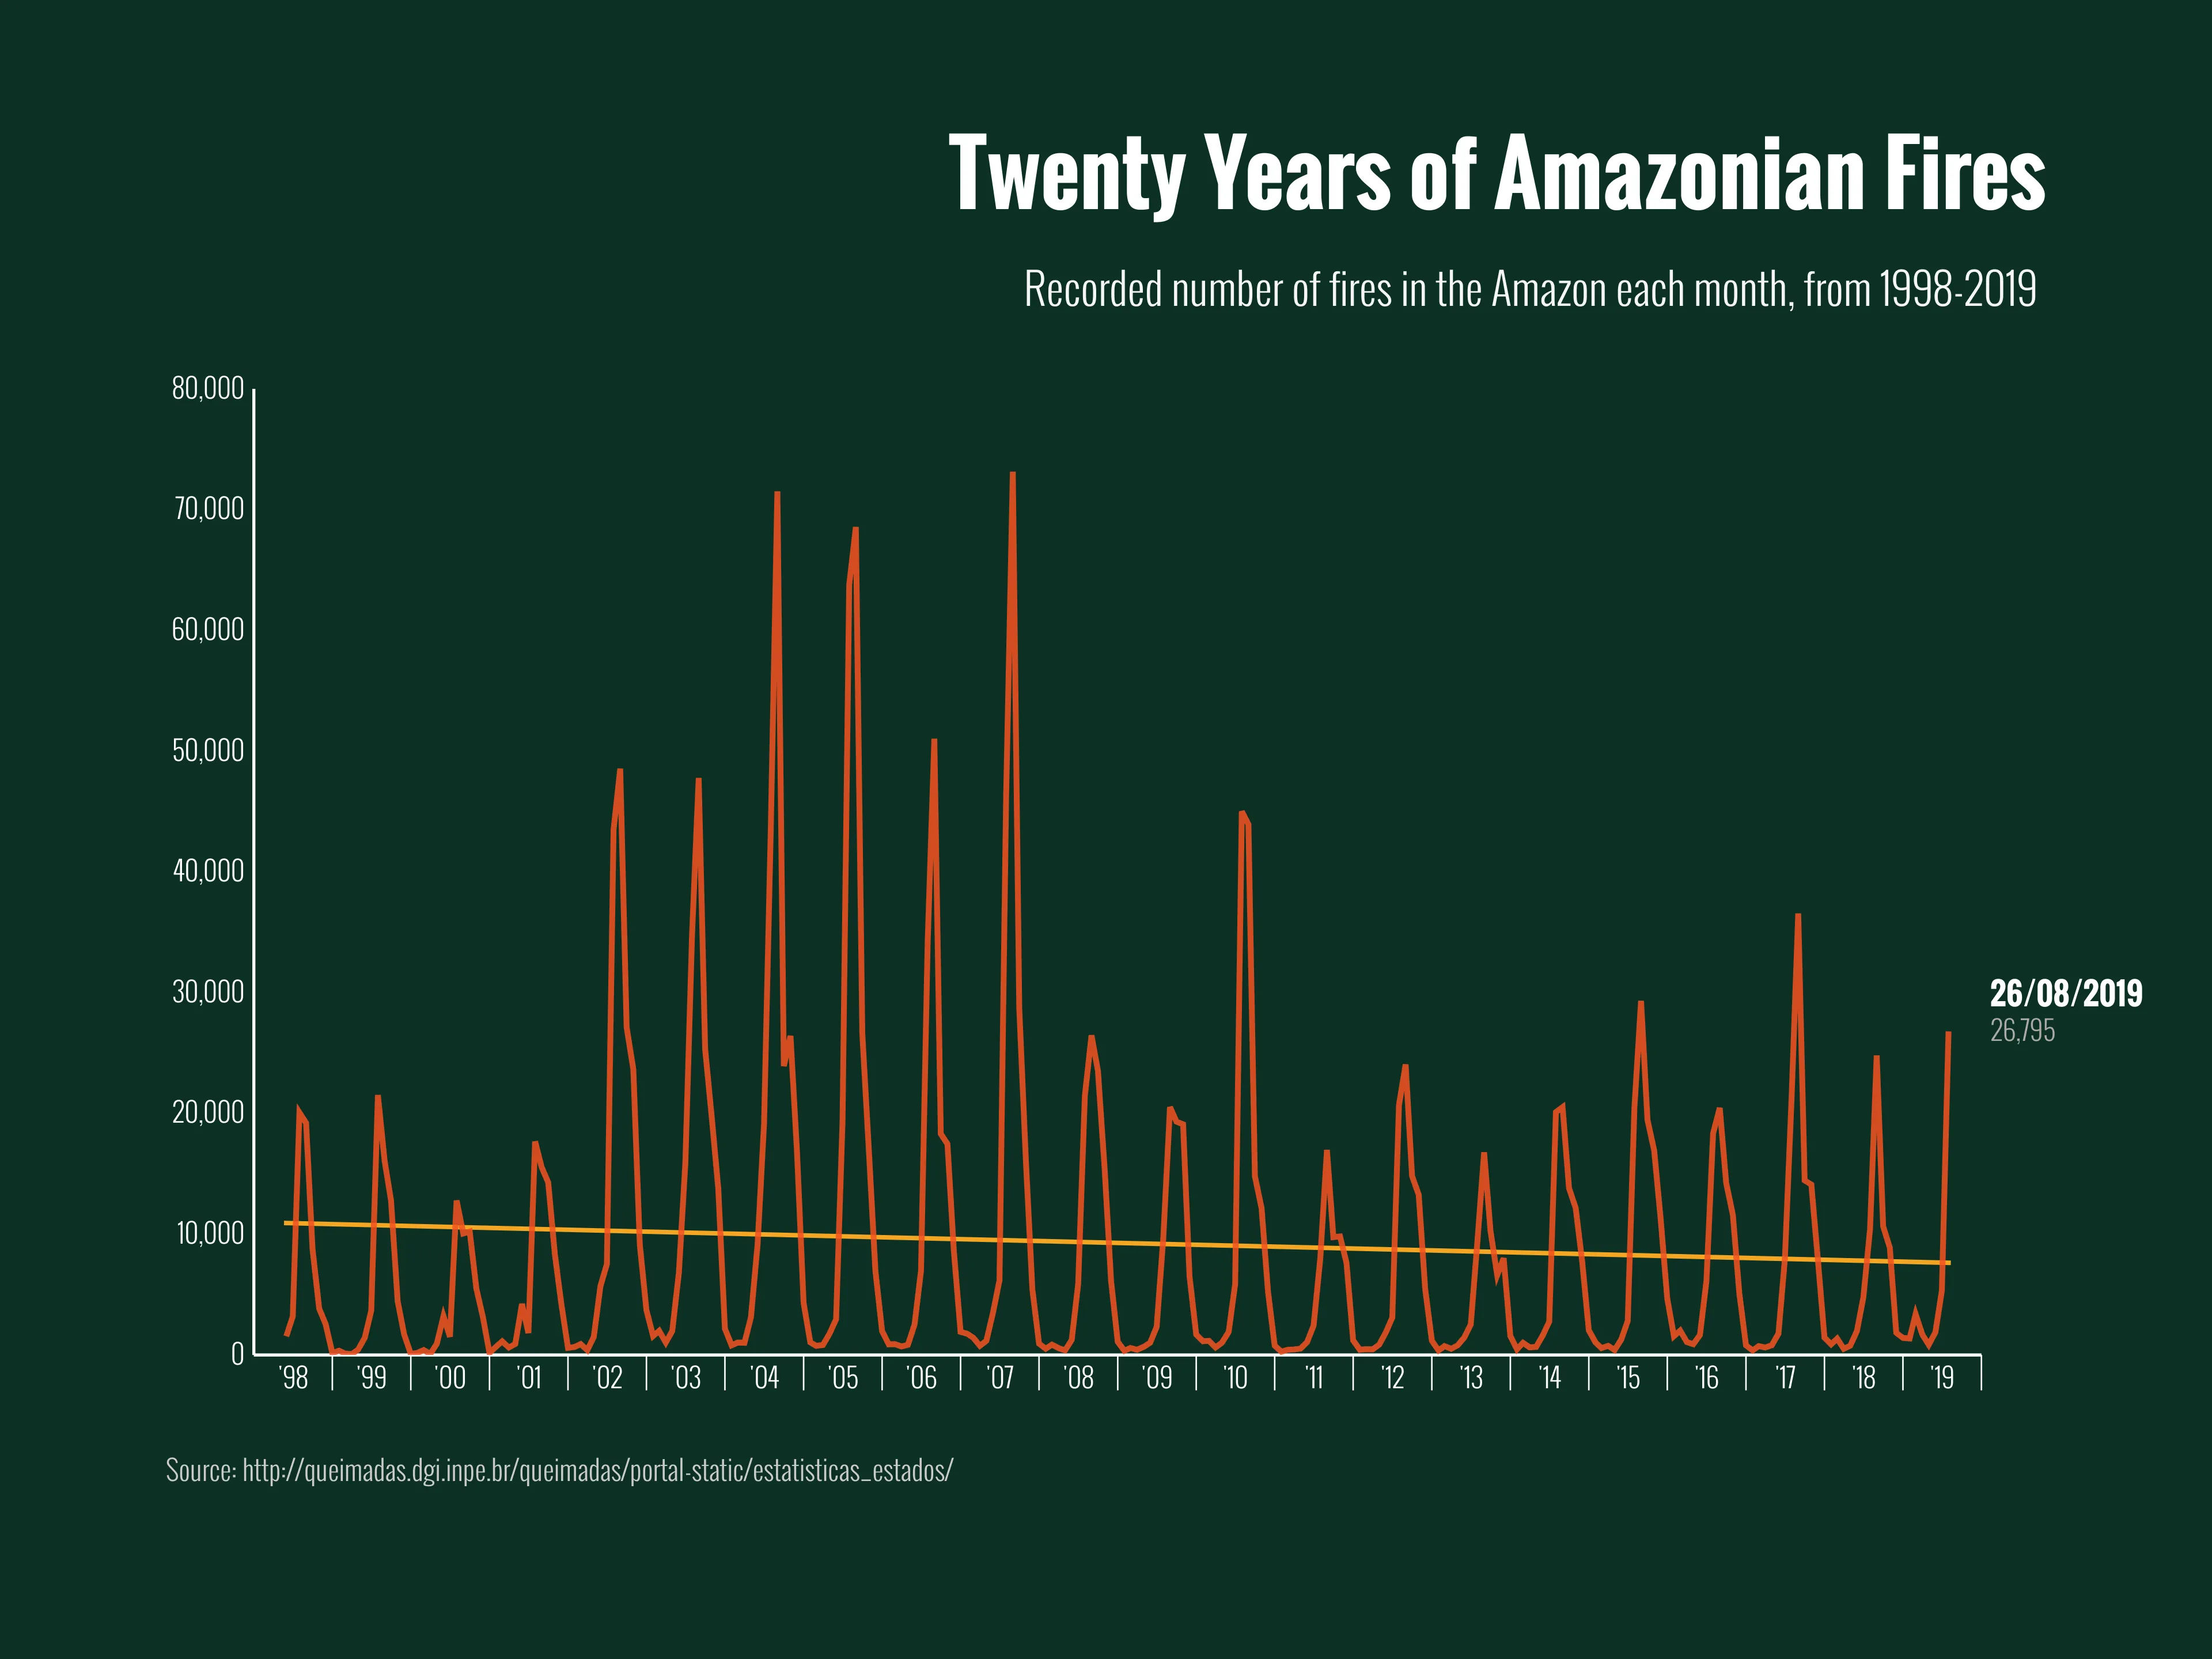
Vizzlo's AI-based chart generatorTwenty Years of Amazonian Fires

With the news that the number of fires detected by satellite in the Amazon region has reached its highest peak since 2010, the data records for the last twenty years can tell us much about the environmental, social and political background of the current natural crisis. Big changes to the regulation of forest-clearing fires were implemented in 2008, and the overall effects of this control are still being felt with the trendline decresing over the chart. However, under a new administration there is less controlling; in addition, ever-increasing global populations and rapidly-changing trade agreements between leading nations in the last five years has increased demand for Brazilian produce and crop-producing land. This all contributes to the potential for fire numbers to peak in the future.

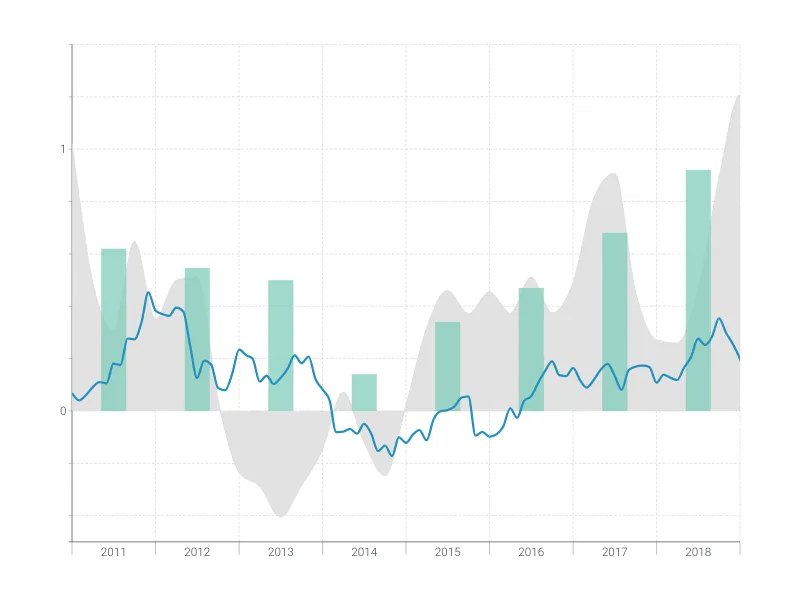
This is an example of Vizzlo's “Time Series Graph”
Complex time series graph to visualize detailed financial data.
Finance & Economics Bar & Column charts Line & Area charts Time-based charts