Chart Vizzard
Vizzlo's AI-based chart generatorUp in Smoke

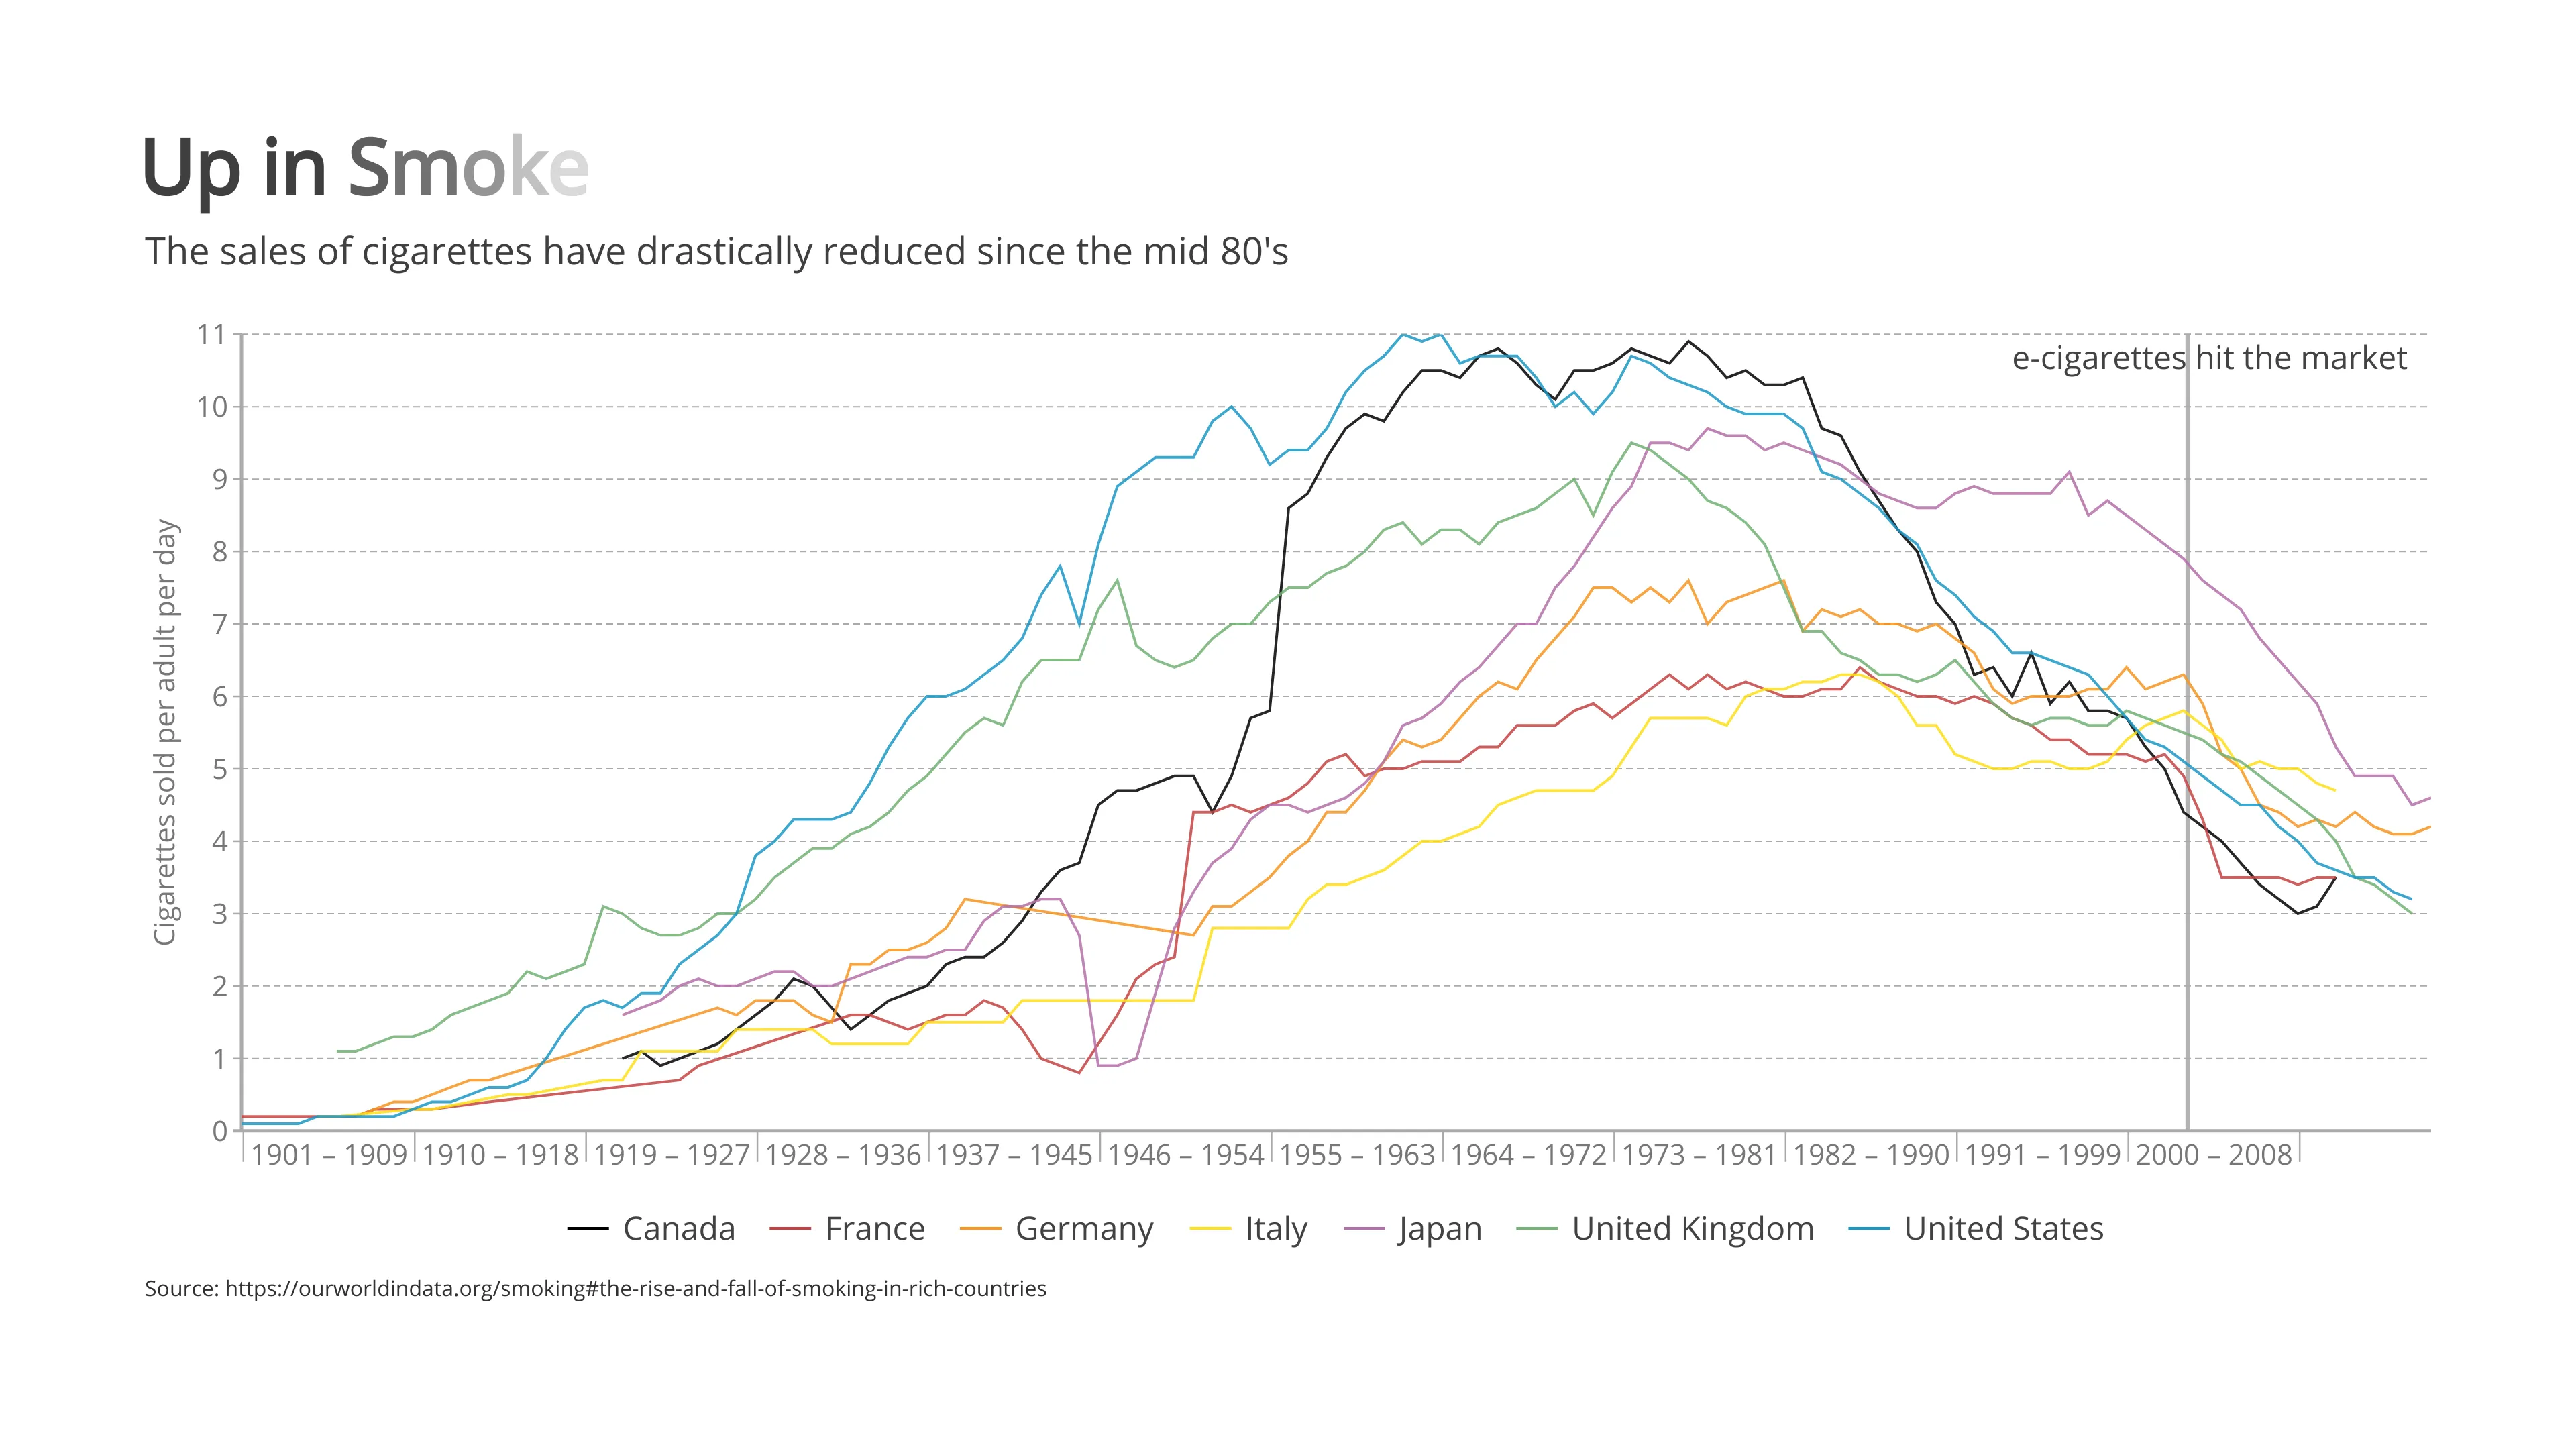
The major health issues caused by smoking cigarettes are agreed upon throughout the world today, and the falling levels of cigarette sales globally reflects this.
The introduction of e-cigarettes in 2003 had a distinct impact on European countries such as Italy, Germany and France, with a sharp decline in tobacco sales reported almost immediately afterwards.
Japan, too, has only seen a significant fall in cigarette smoking in recent years, but the correlation is not so clearly associated with a switch to vaping as sales were already suffering for some years before (most likely due to a recession hitting Japan alongside higher tobacco prices).
Japan’s most extreme drop in cigarette smoking, however, was a brief period after the Second World War, when rationing and global trade sanctions created a lack of supply. As soon as trade relations normalised once more, the upward trend in smoking continued as if there had been no cessation.
The United States, Canada and the United Kingdom all saw sharp declines in tobacco usage during the mid 70’s to early 80’s - long before e-cigarettes would become a viable smoking alternative. While changing attitudes towards health and the formulation of nicotine patches were prevalent at this time, dates align more closely with sharp increases in taxation of tobacco products in these regions.

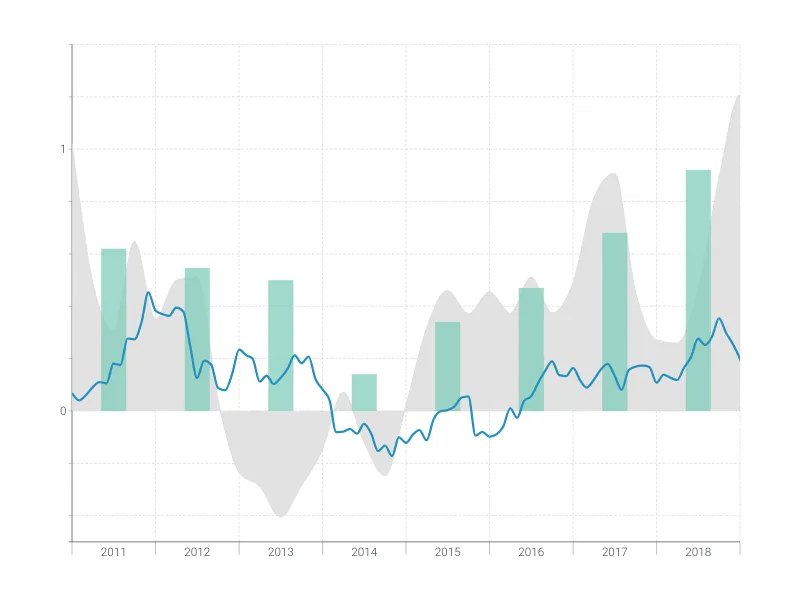
This is an example of Vizzlo's “Time Series Graph”
Complex time series graph to visualize detailed financial data.
Finance & Economics Bar & Column charts Line & Area charts Time-based charts