Chart Vizzard
Vizzlo's AI-based chart generatorPrimary Energy Consumption per capita and Continent

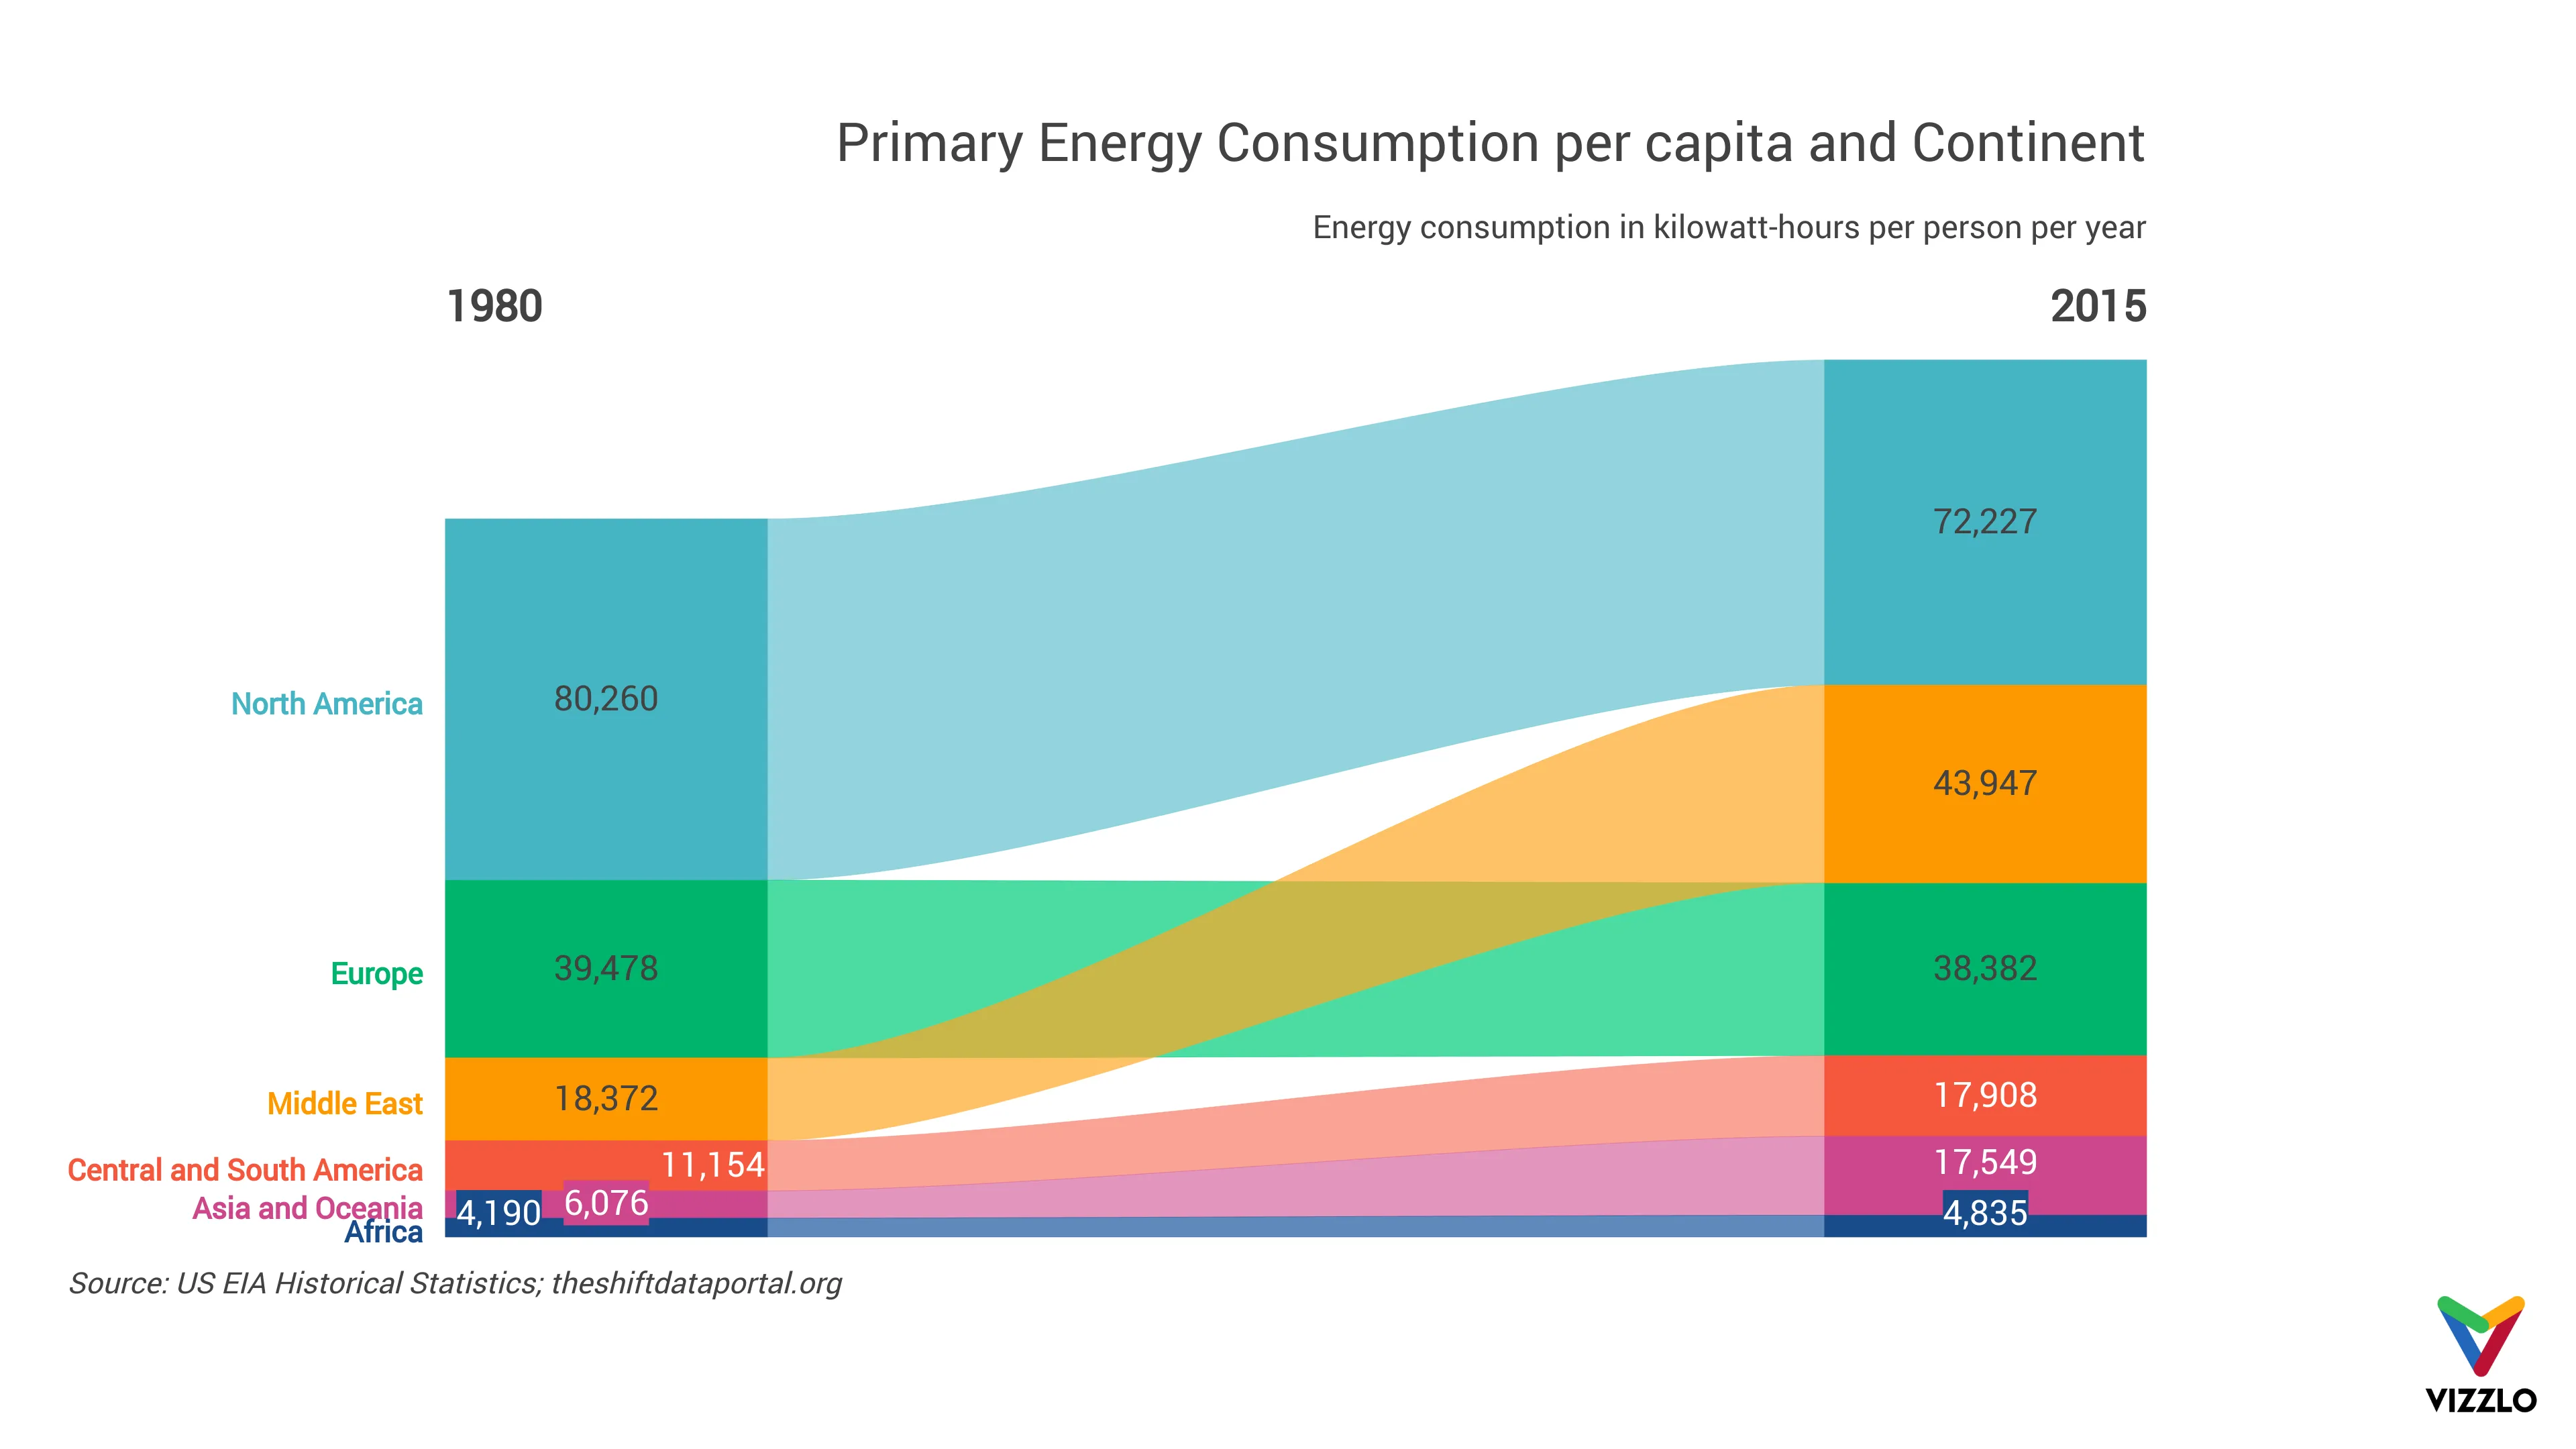
Average per capita energy consumption rose steadily worldwide between 1980 and 2015. The regional differences are obvious: per capita energy consumption was and is highest in North America, even though it has fallen by about 10 percent since 1980. Compared to Africa, average per capita consumption is about 15 times higher.
The greatest growth in per capita energy consumption in recent decades can be attributed to middle-income transition countries, such as the BRICS nations.
Nevertheless, per capita energy consumption there is still far below the level in North America or Europe.

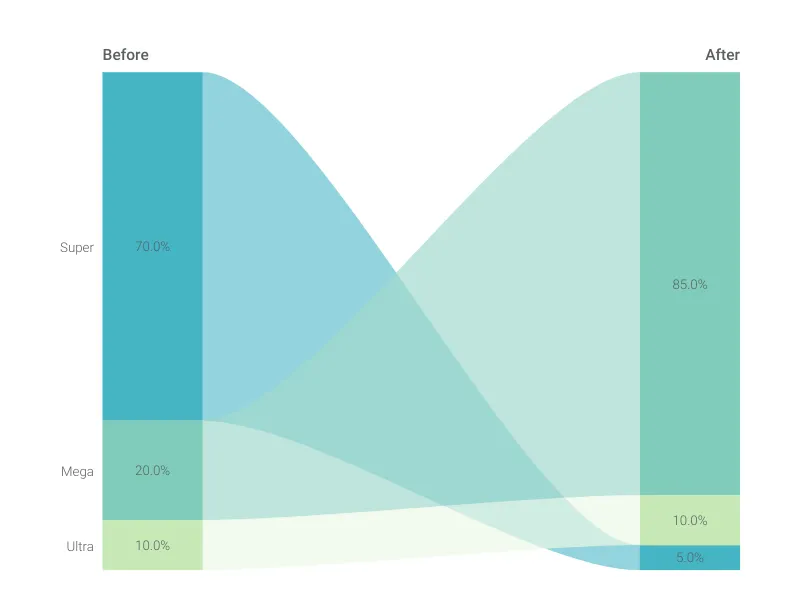
This is an example of Vizzlo's “Value Projection”
Use a value projection to compare the values of different categories in two different moments.
Finance & Economics Sales & Marketing Pitchdeck essentials for Startups Line & Area charts