PREVIEW
Chart Vizzard
Vizzlo's AI-based chart generatorInformation design

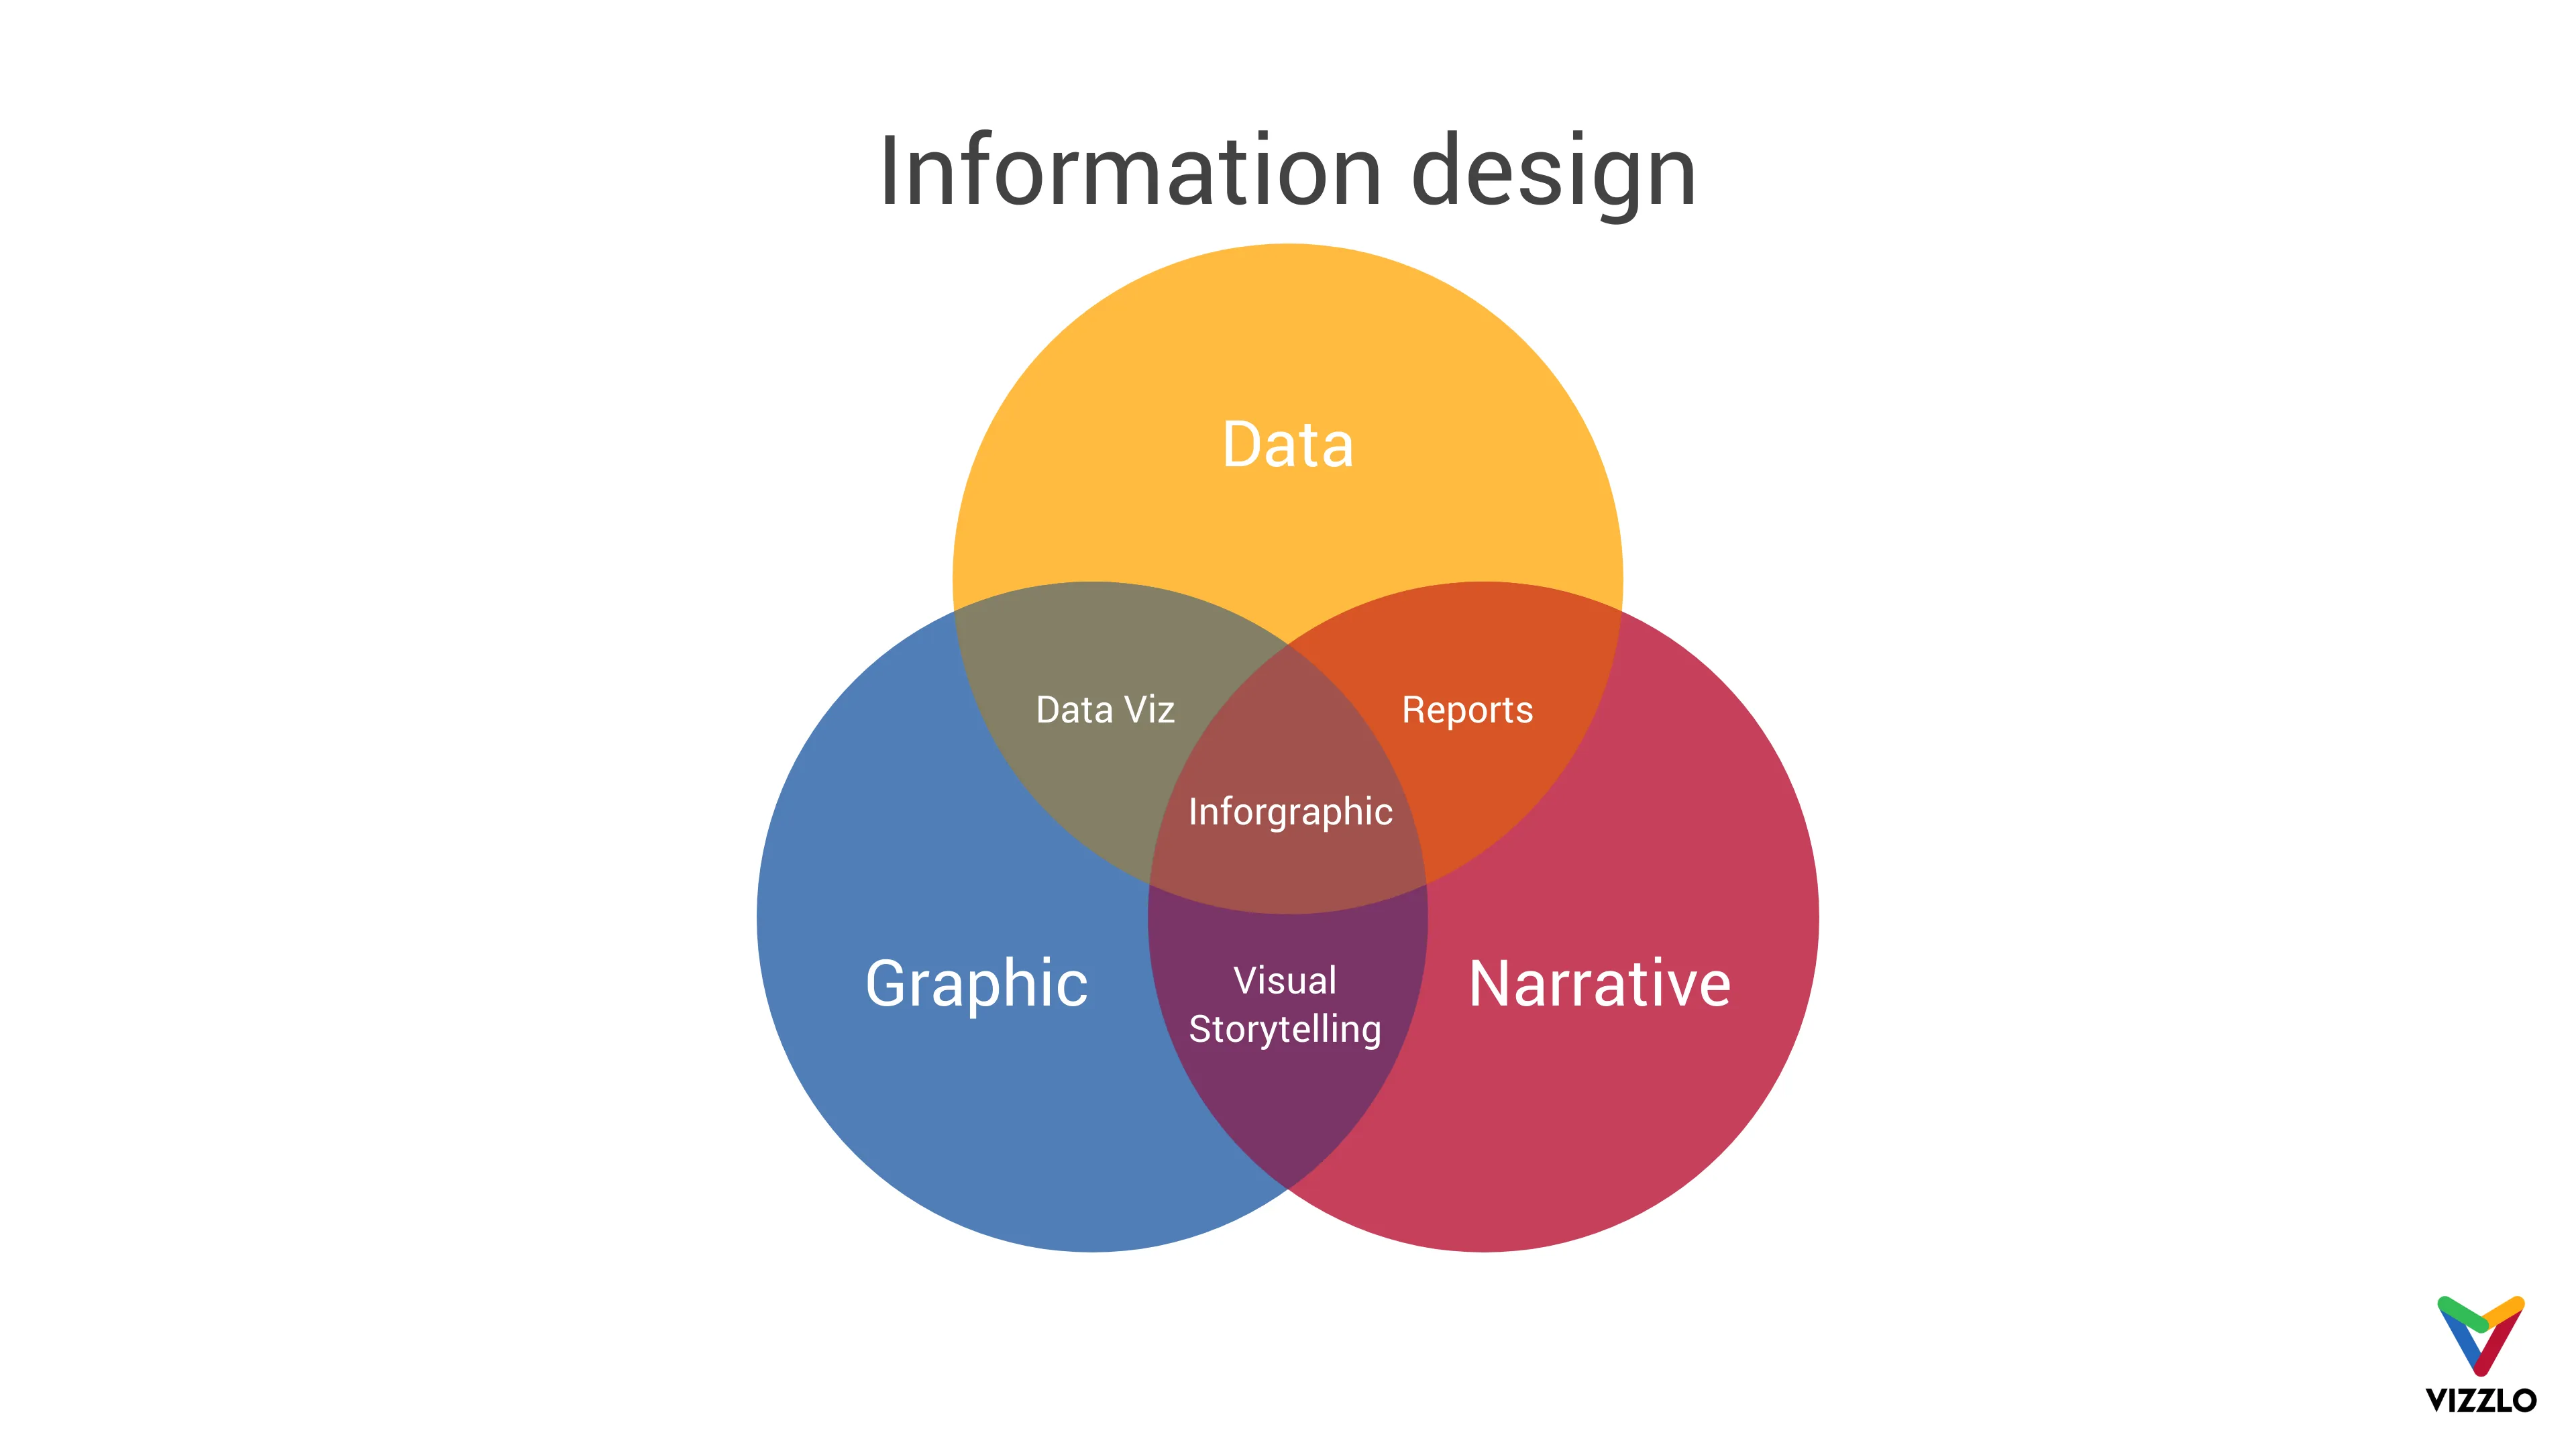
Data graphics and charts let you explore and learn about the structure of the information you collect. Good data visualizations display measured quantities in a way to make it easy to communicate your ideas and findings. Whether presented in research articles, business slide decks, public, or media reports. Information design is the subject of letting people access data in a visual way.

This is an example of Vizzlo's “Venn Diagram”
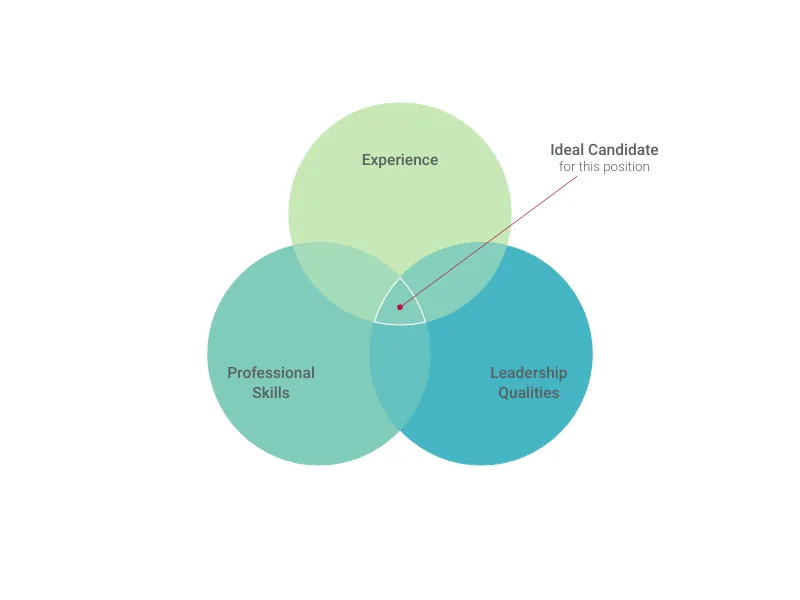
Create a Venn diagram to visualize intersections and differences between groups.
Pitchdeck essentials for Startups Line & Area charts Process & Structure diagrams