Chart Vizzard
Vizzlo's AI-based chart generatorJanuary 2, 2018 • 2 min read
Cheers to the new year!
And a brief 2017 recap (or why Vizzlo had a fantastic year)

2017 was a year of significant milestones, innumerable releases, and intense learning at Vizzlo. Portfolio additions and experience improvements marked this amazing year for us.
But, most importantly, all this novelty and these changes were crucial steps towards achieving our goal of becoming the best and easiest tool for creating beautiful concept-driven and data-driven visualizations.
Let’s look back?!
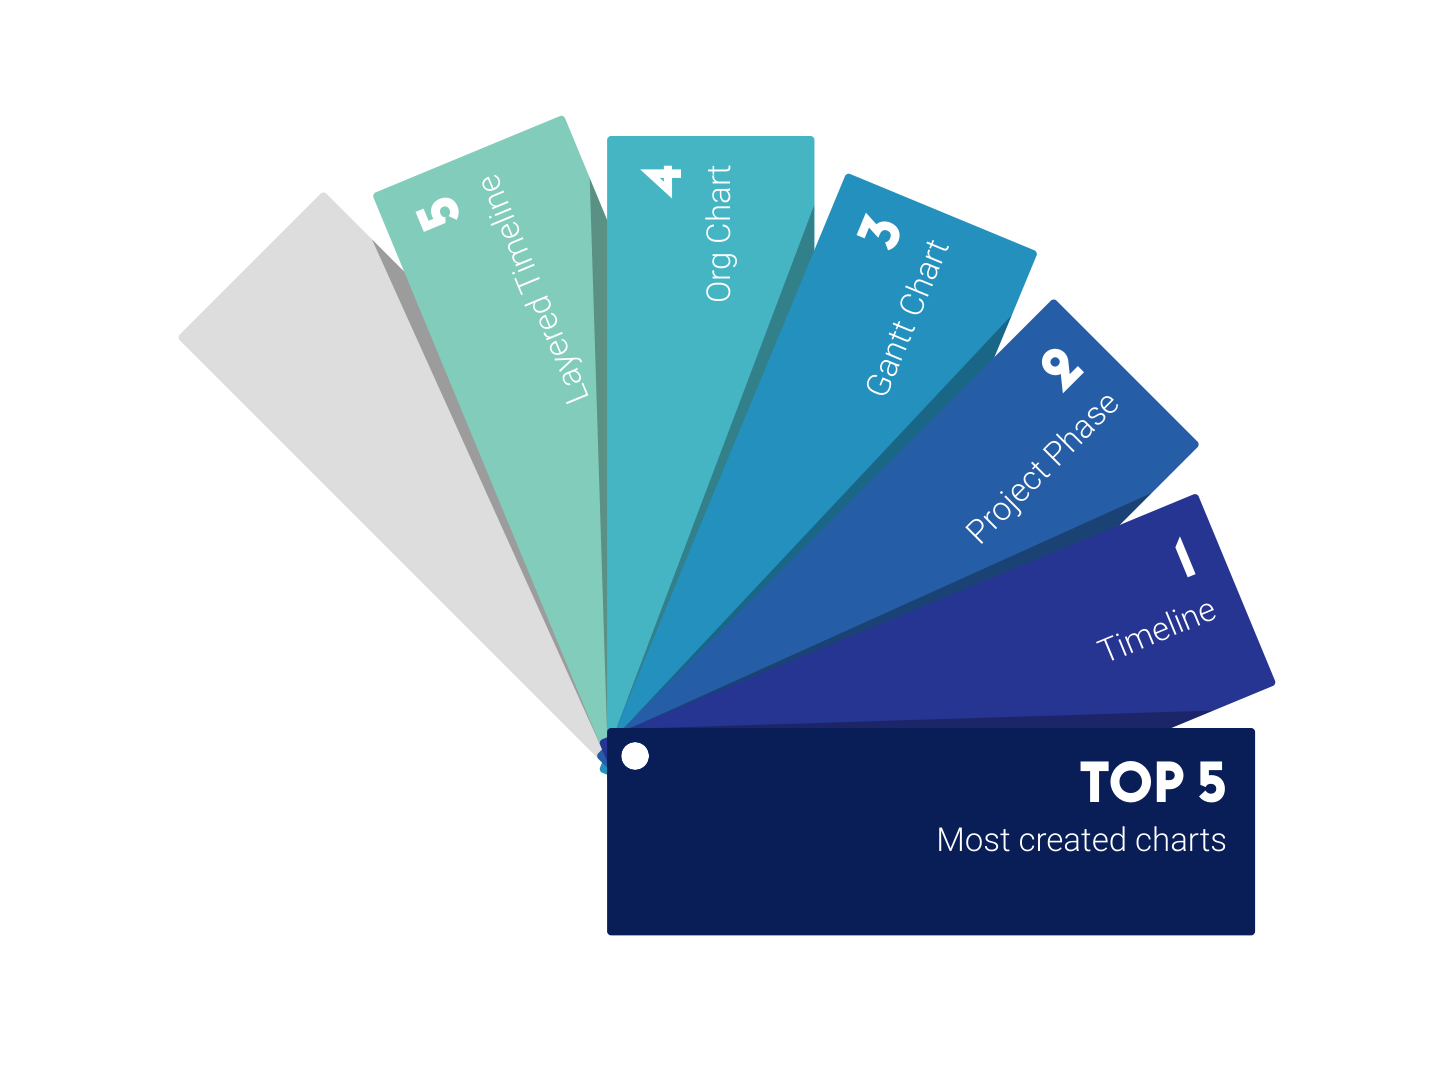
90+ designer-grade charts and business graphics
We expanded Vizzlo’s portfolio with charts to help project managers and strategy teams to plan, visualize and communicate their goals. We also improved essential data-driven and concept-driven visualizations (such as bar, line, and circular graphs, as well as the most used milestone plans, process, and strategic charts so that now they even easier to create and interpret.
2017 brought our best interface yet
We started to build on the user interface, implementing the organization of your documents into folders, incorporating the “annotations” feature to the charts, and enhancing the chart editor.
2018 won’t be any different: we’ll keep working hard to make your experience with Vizzlo more straightforward and enjoyable. From choosing to exporting any chart, we hope to make your journey smooth and successful.
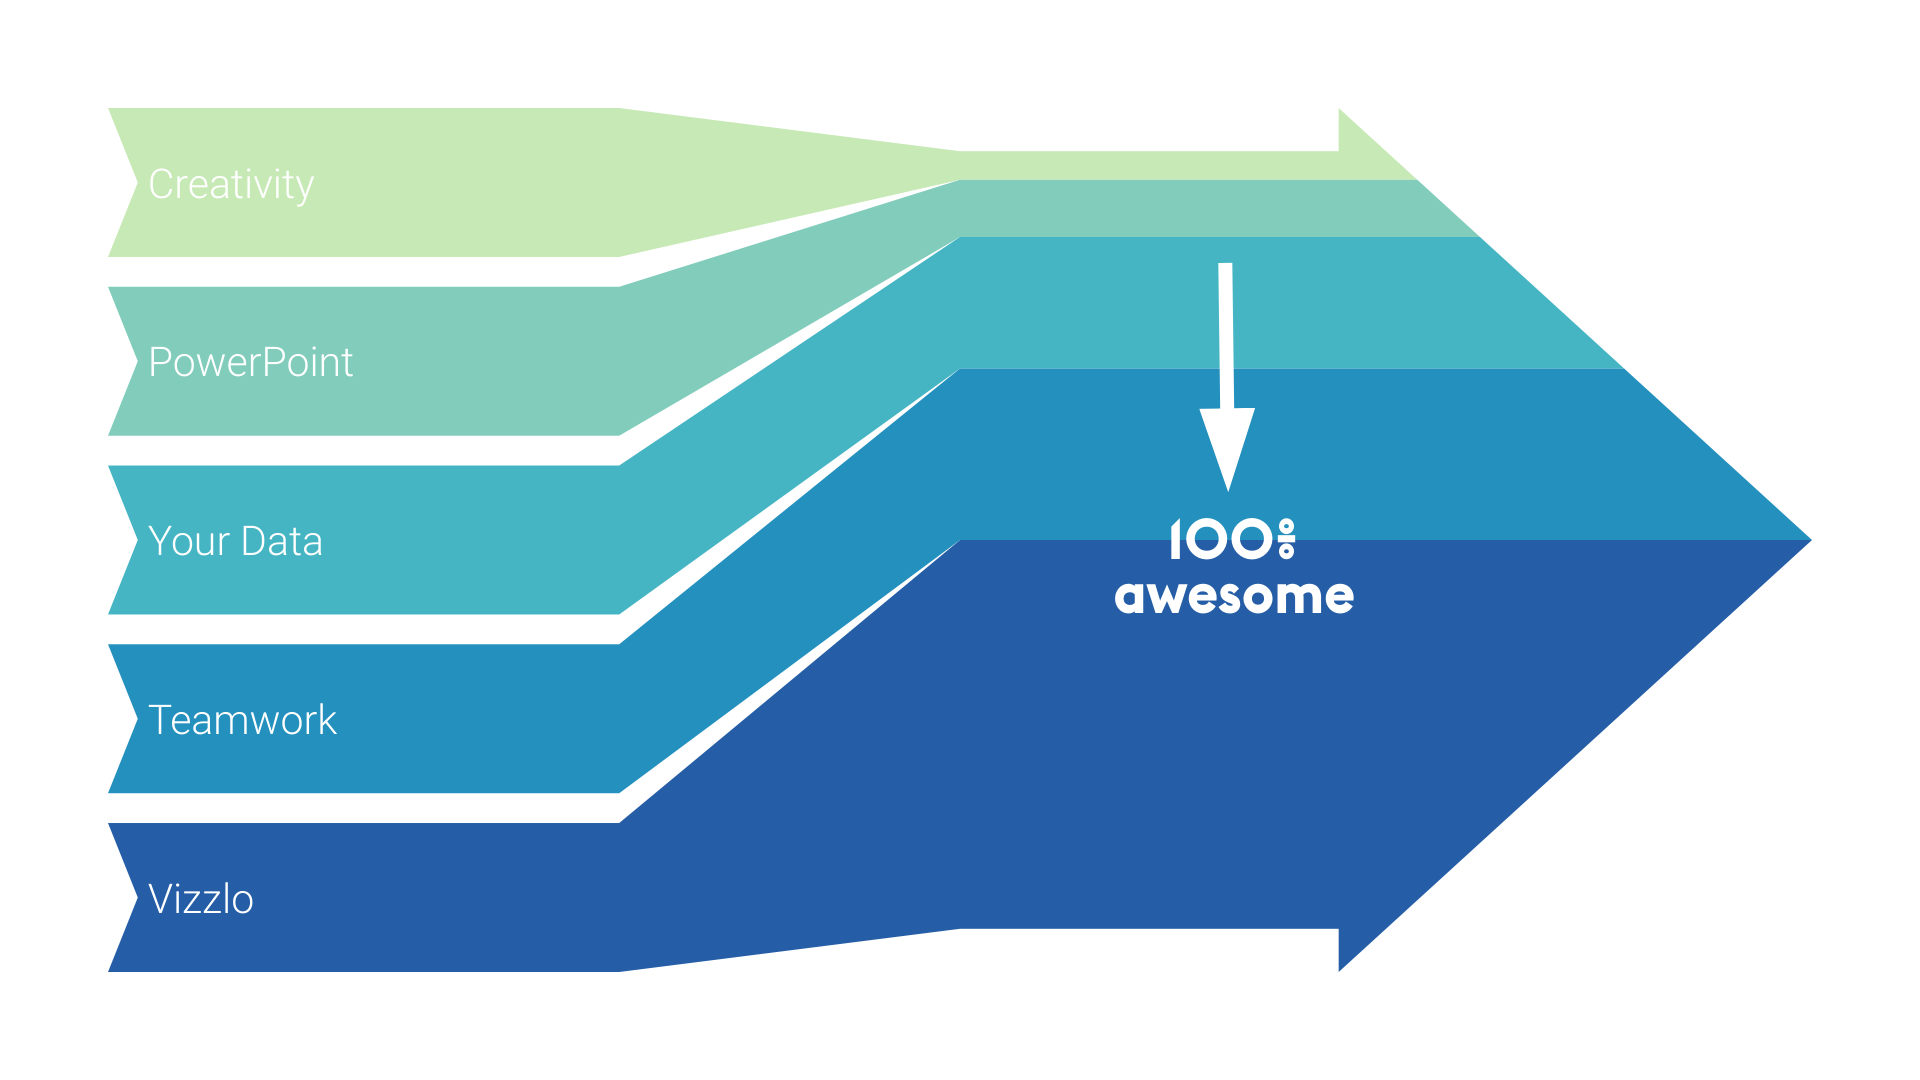
Collaboration and integration
The introduction of the sharing features enabled better teamwork, by making possible for teams to edit visualizations together and to make charts available to the whole team.
Last but not least, we launched Vizzlo’s PowerPoint add-in to create and update charts directly in PowerPoint. This is the first of various integrations we’ll develop to embed Vizzlo even better into your workflow.
You + Vizzlo ❤
We’re are thankful for all the trust and the feedback that we received from our users. We were able to learn where to improve, look to the future and plan the next steps with your perspective in mind.
That’s a promise: this new year will be exceptional! We’ll keep you posted with our updates and releases.
We wish you and your closest ones a happy and prosperous new year! And don’t forget: create your charts and visualizations with Vizzlo, present, and impress in 2018.