Chart Vizzard
Vizzlo's AI-based chart generatorCircular Agenda
Plan a whole year or a day, or quickly display recurring activities/events with this beautiful agenda chart.
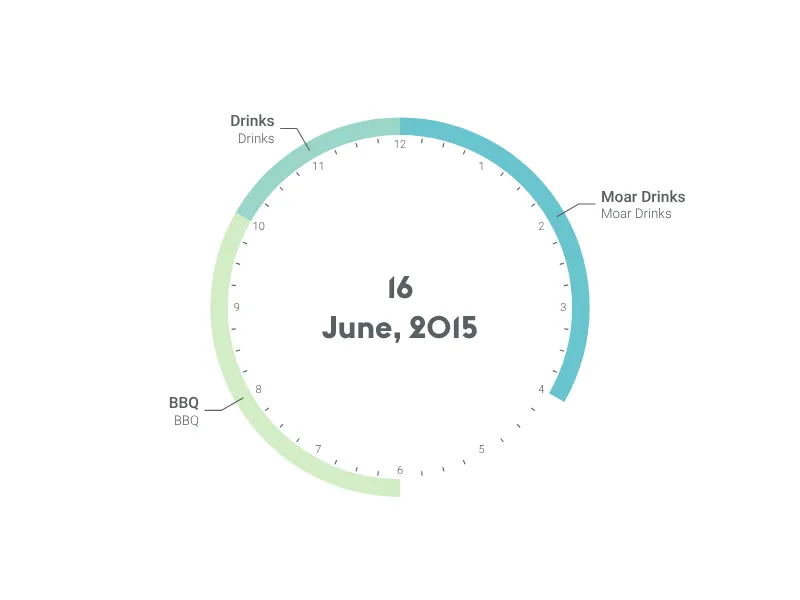
What is a circular agenda?
A circular agenda is a chart whose circumference corresponds to 100% of a given time (one year, 12 or 24 hours). Each of the slices marks a period, with begin and end dates or hours.
This chart is great to offer a simple overview of tasks and events ahead and effectively shows recurring activities and routines.
How to make a circular agenda with Vizzlo?
Vizzlo’s circular agenda looks great and is very easy to create. Just follow these steps:
- On the tab “APPEARANCE,” select the date format and the granularity of your dial.
- Click on the time slices to edit them. Drag their extremes to adjust their duration.
- Click and drag the mouse over the dial to create a new period.
- You can also use the active cards in the sidebar as a support to change title, description, dates, colors of your periods.
- Or copy and paste your data into Vizzlo’s spreadsheet (click the button “EDIT DATA IN SPREADSHEET”).
- Explore the settings of the “APPEARANCE” tab and customize your chart.
Circular agenda chart maker: key features
- Custom date format
- Custom granularity: 12h, 24h, year
- Optional markers
Circular Agenda: What's new?
Circular Agenda Alternatives
Enhance your productivity
Create a Circular Agenda directly in the tools you love

Create a Circular Agenda in PowerPoint with
Vizzlo's add-in

Loved by professionals around the world


Visualizations your audience won’t forget
Convey abstract concepts and data with professionally designed
charts and graphics you can easily edit and customize.