Chart Vizzard
Vizzlo's AI-based chart generatorCreate your Color Fan in seconds
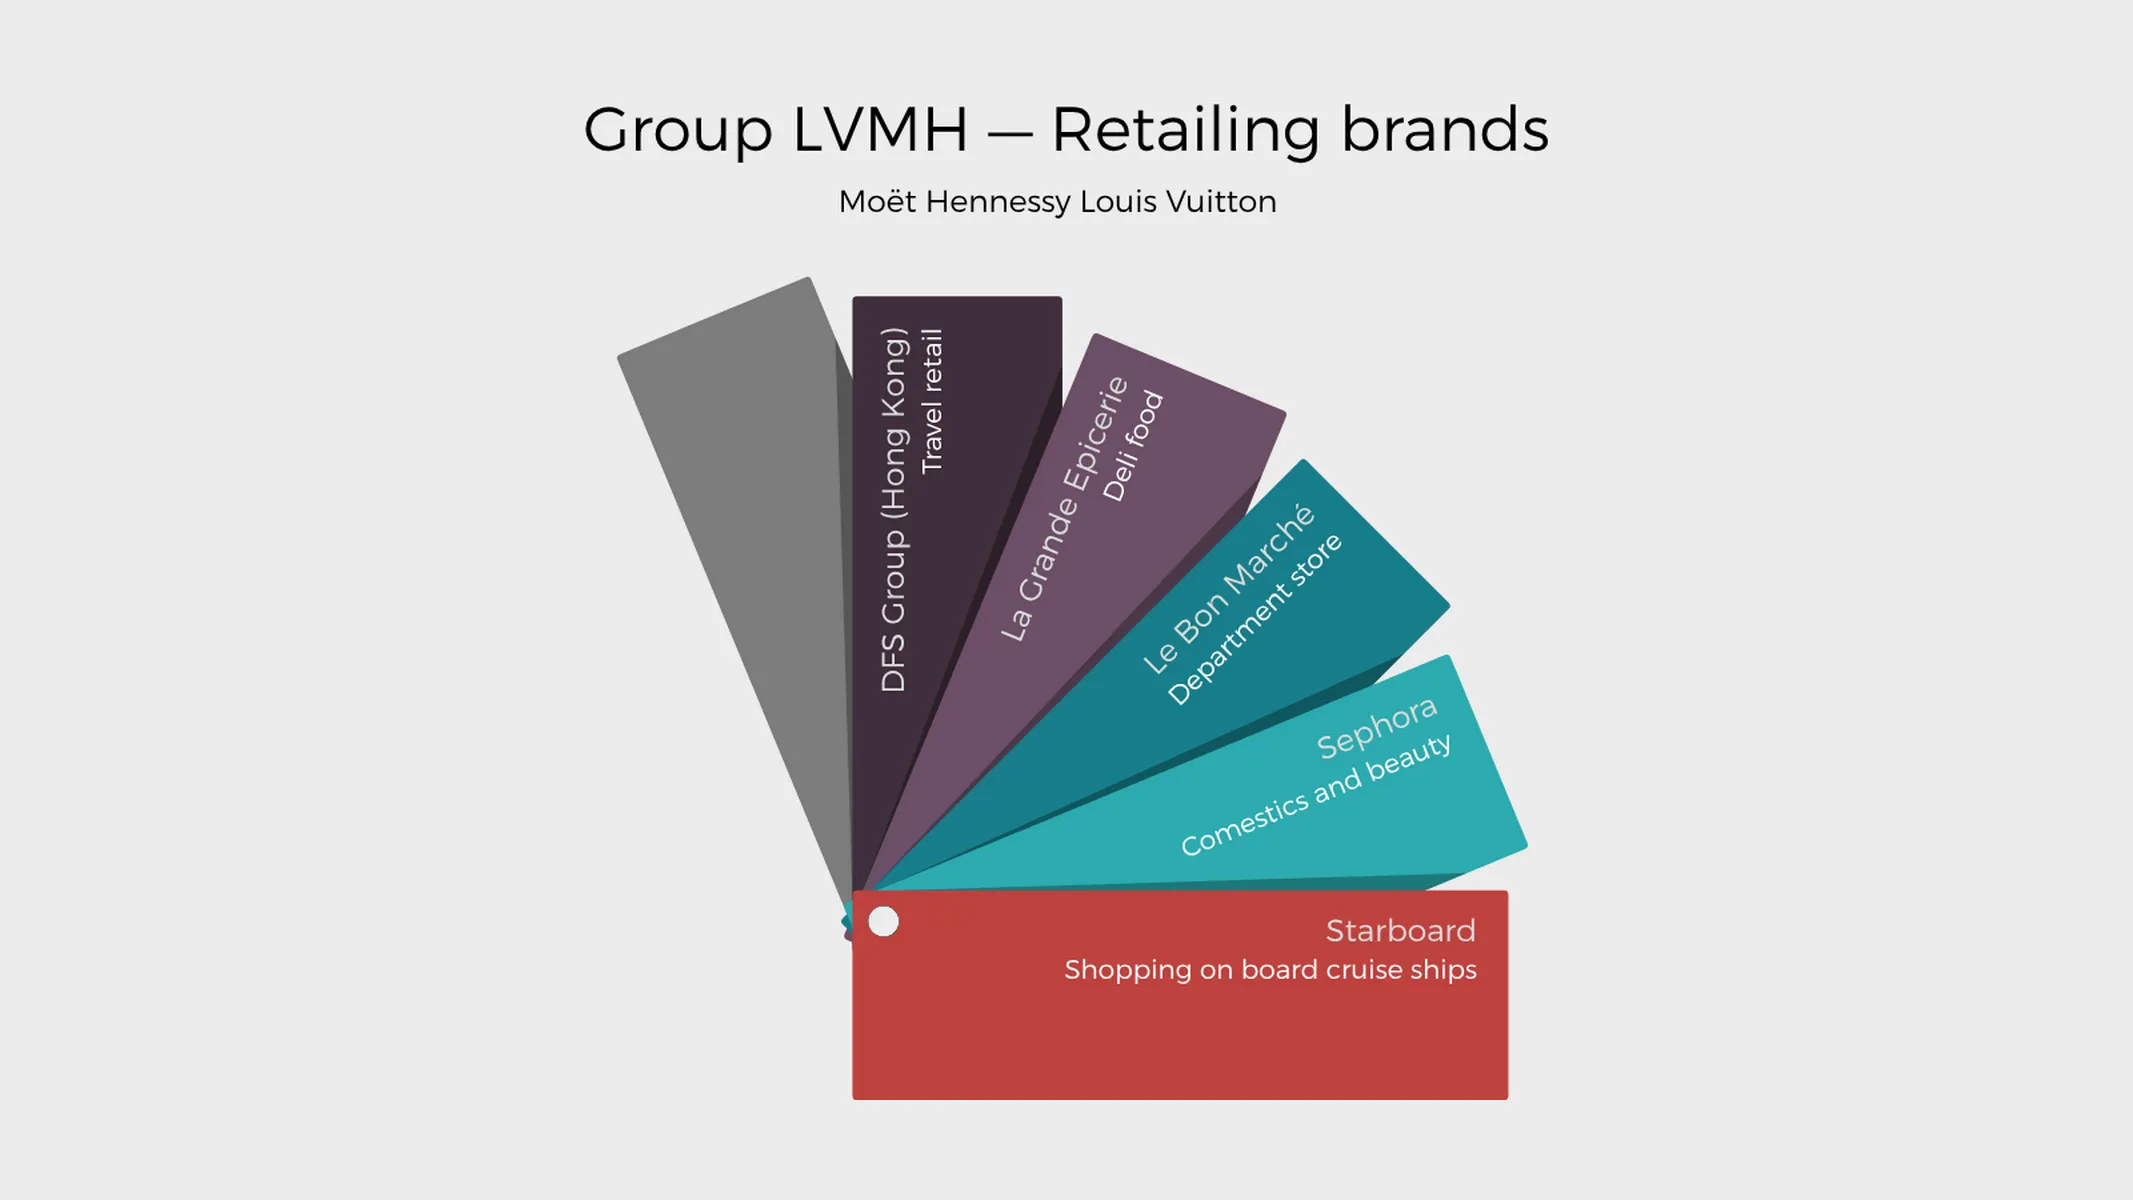
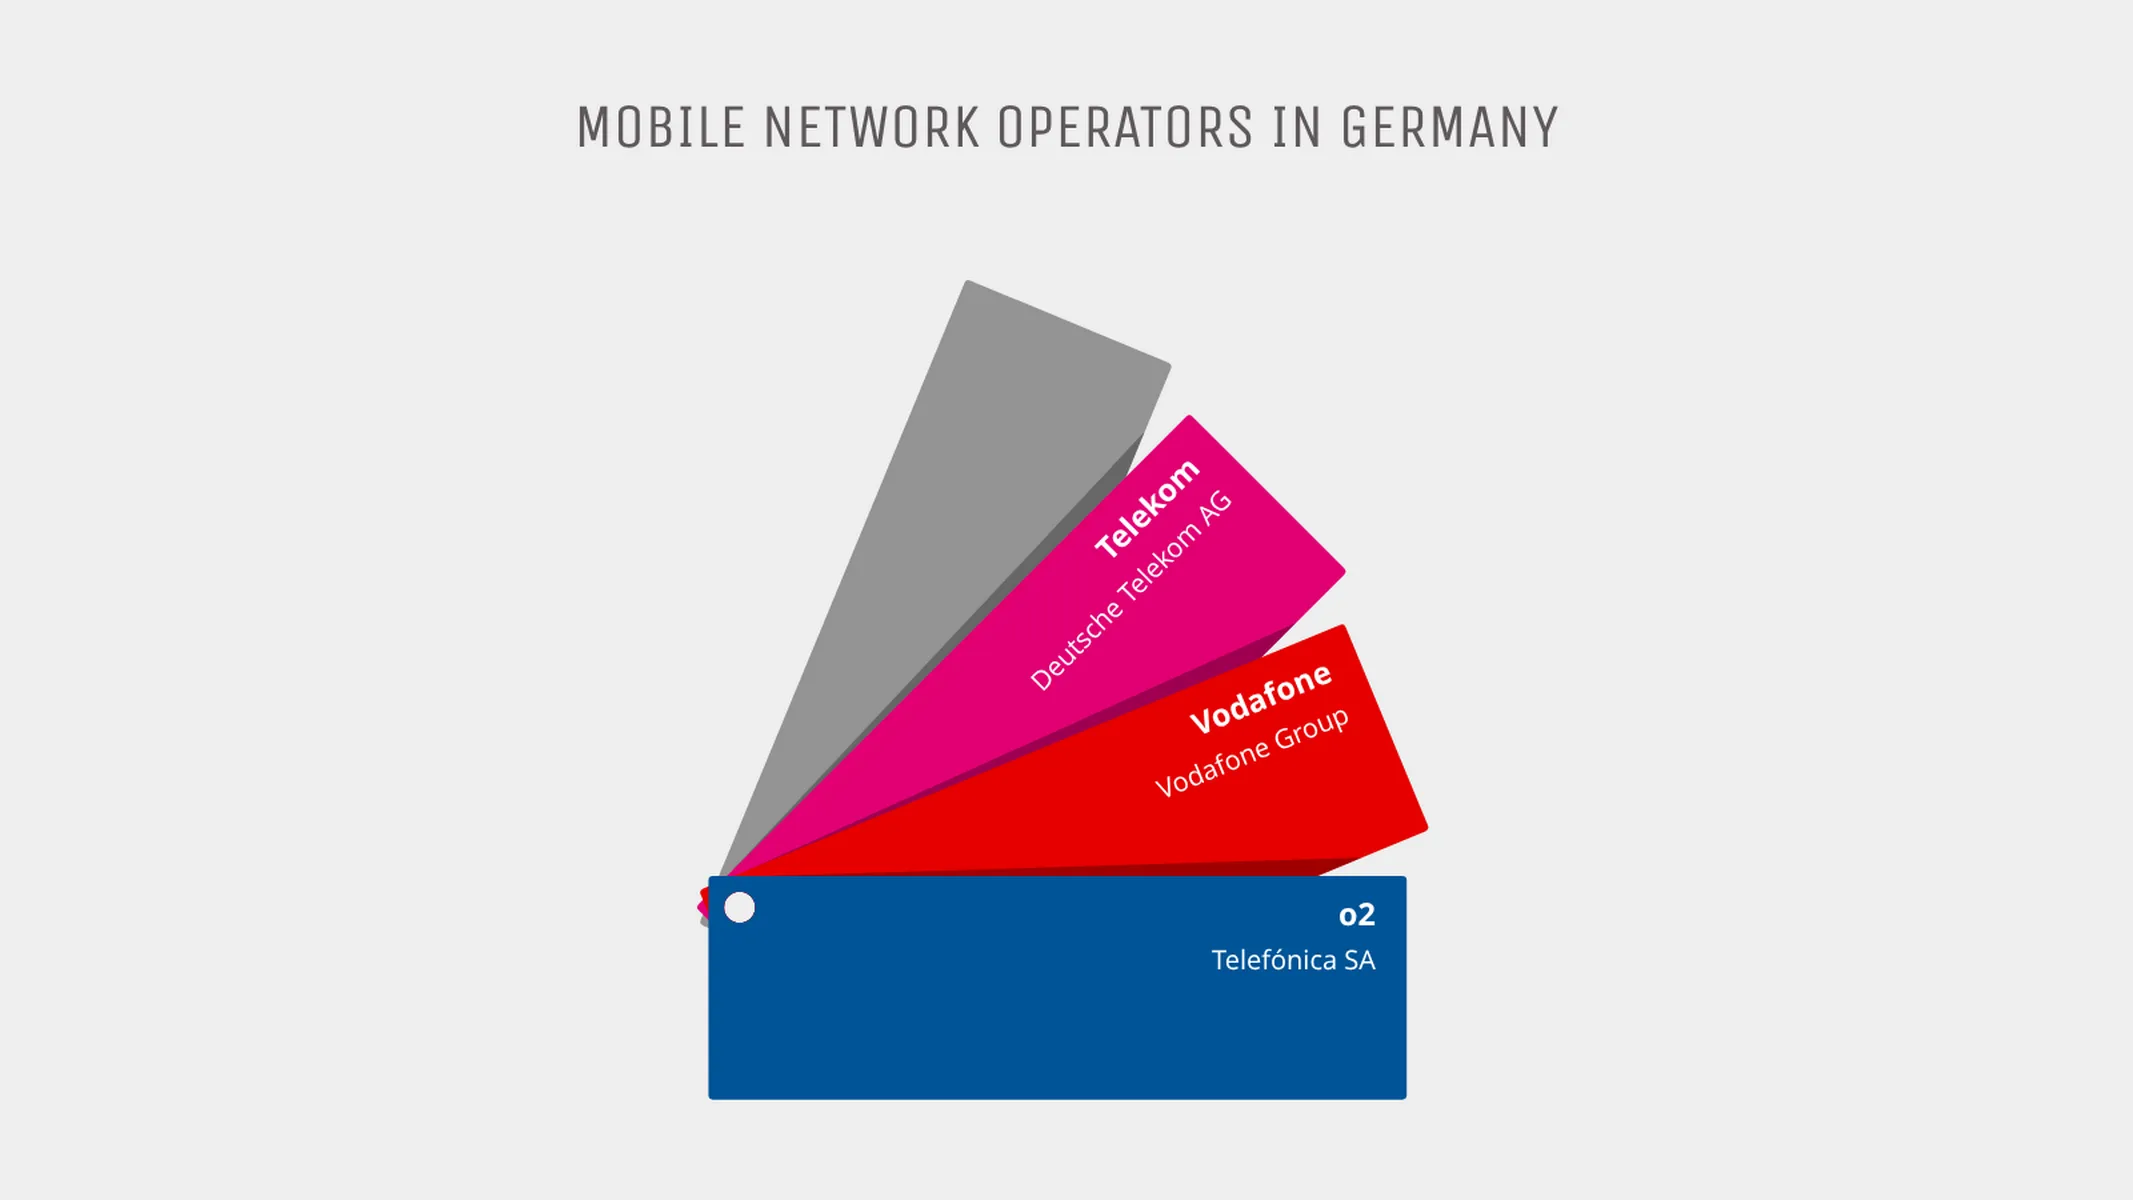
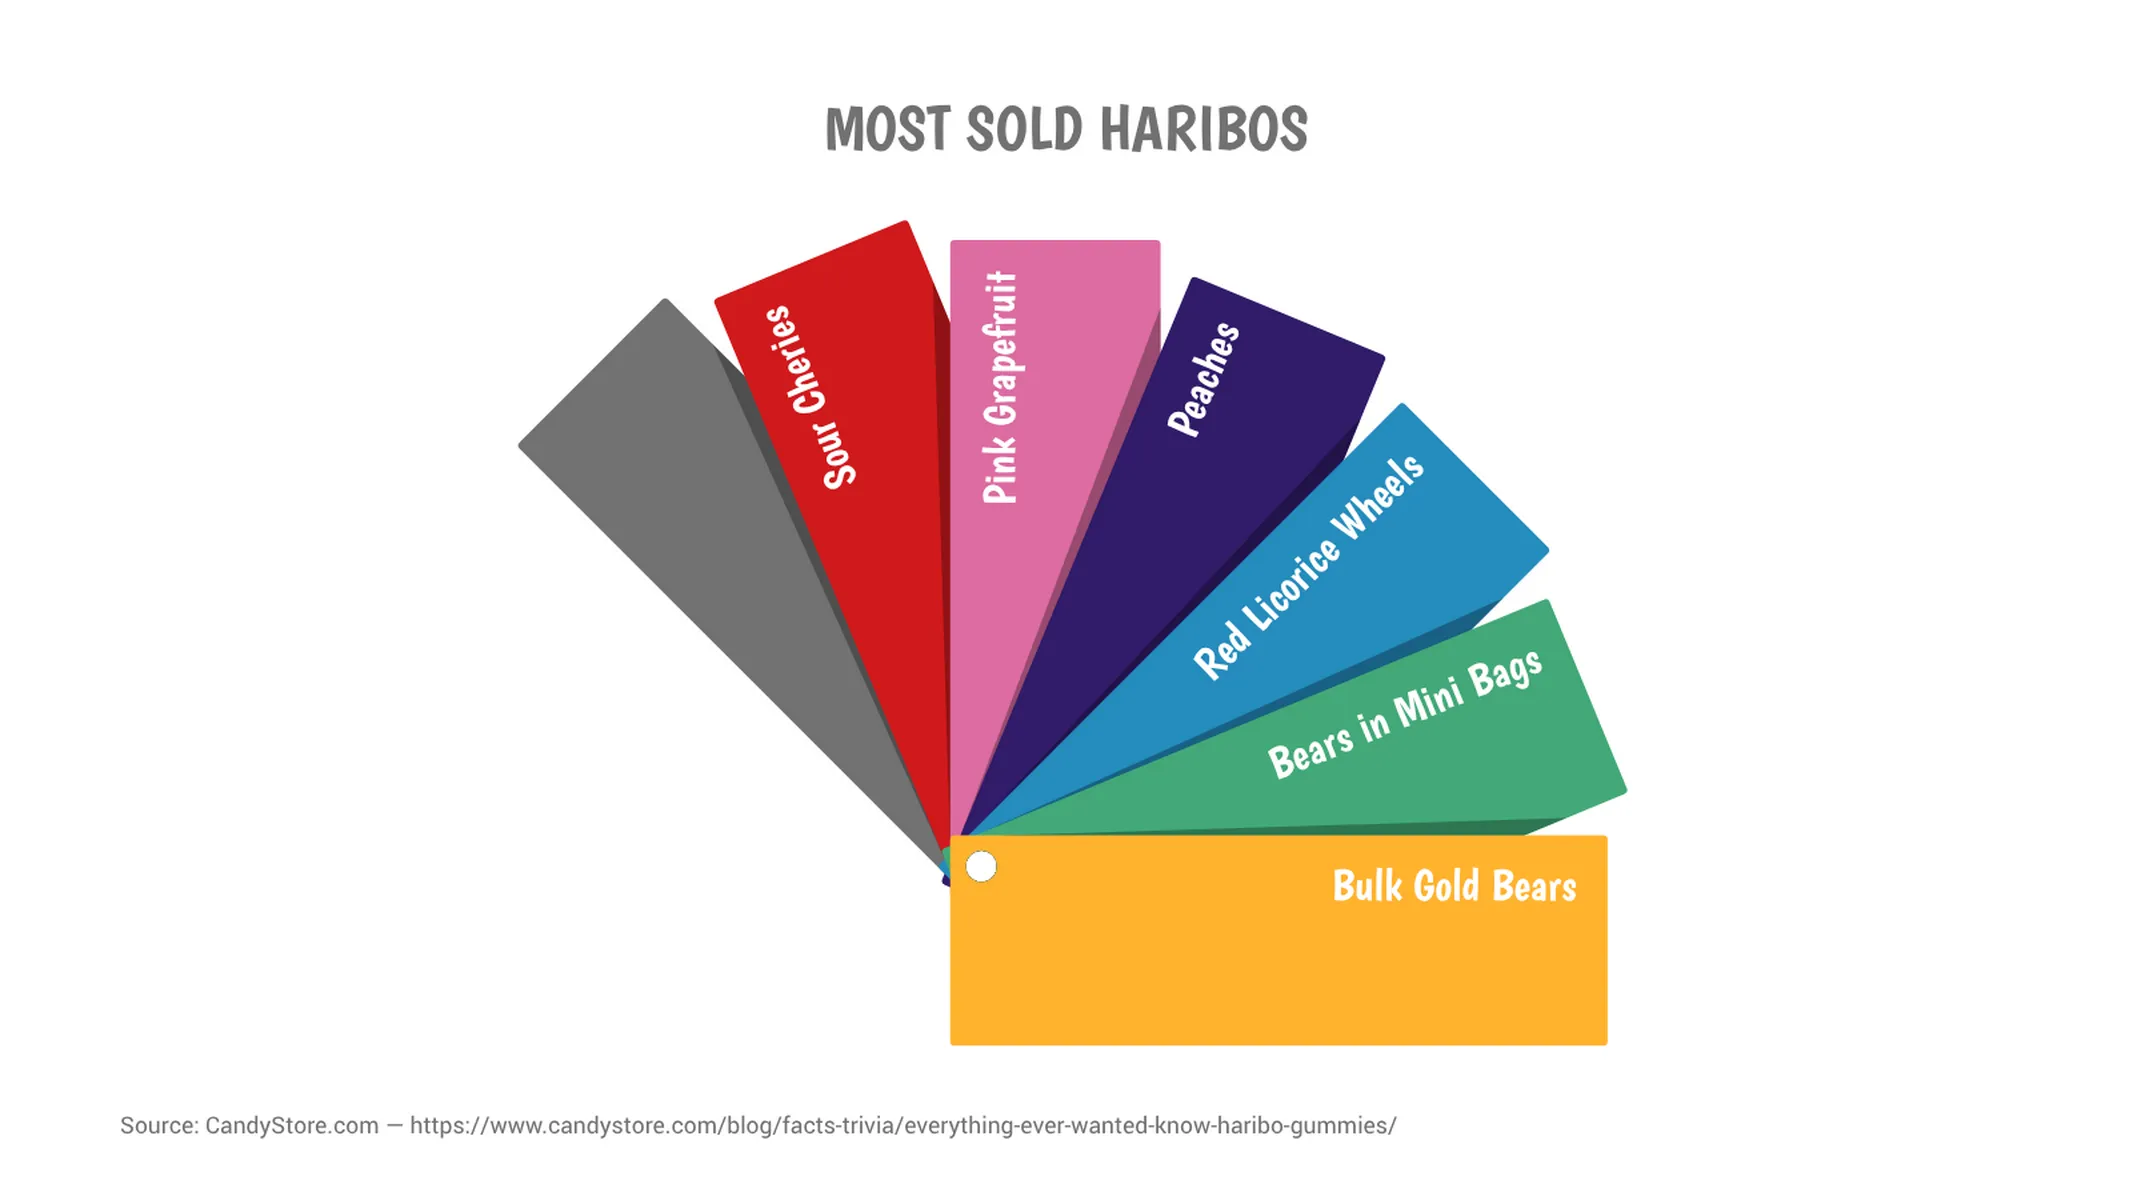
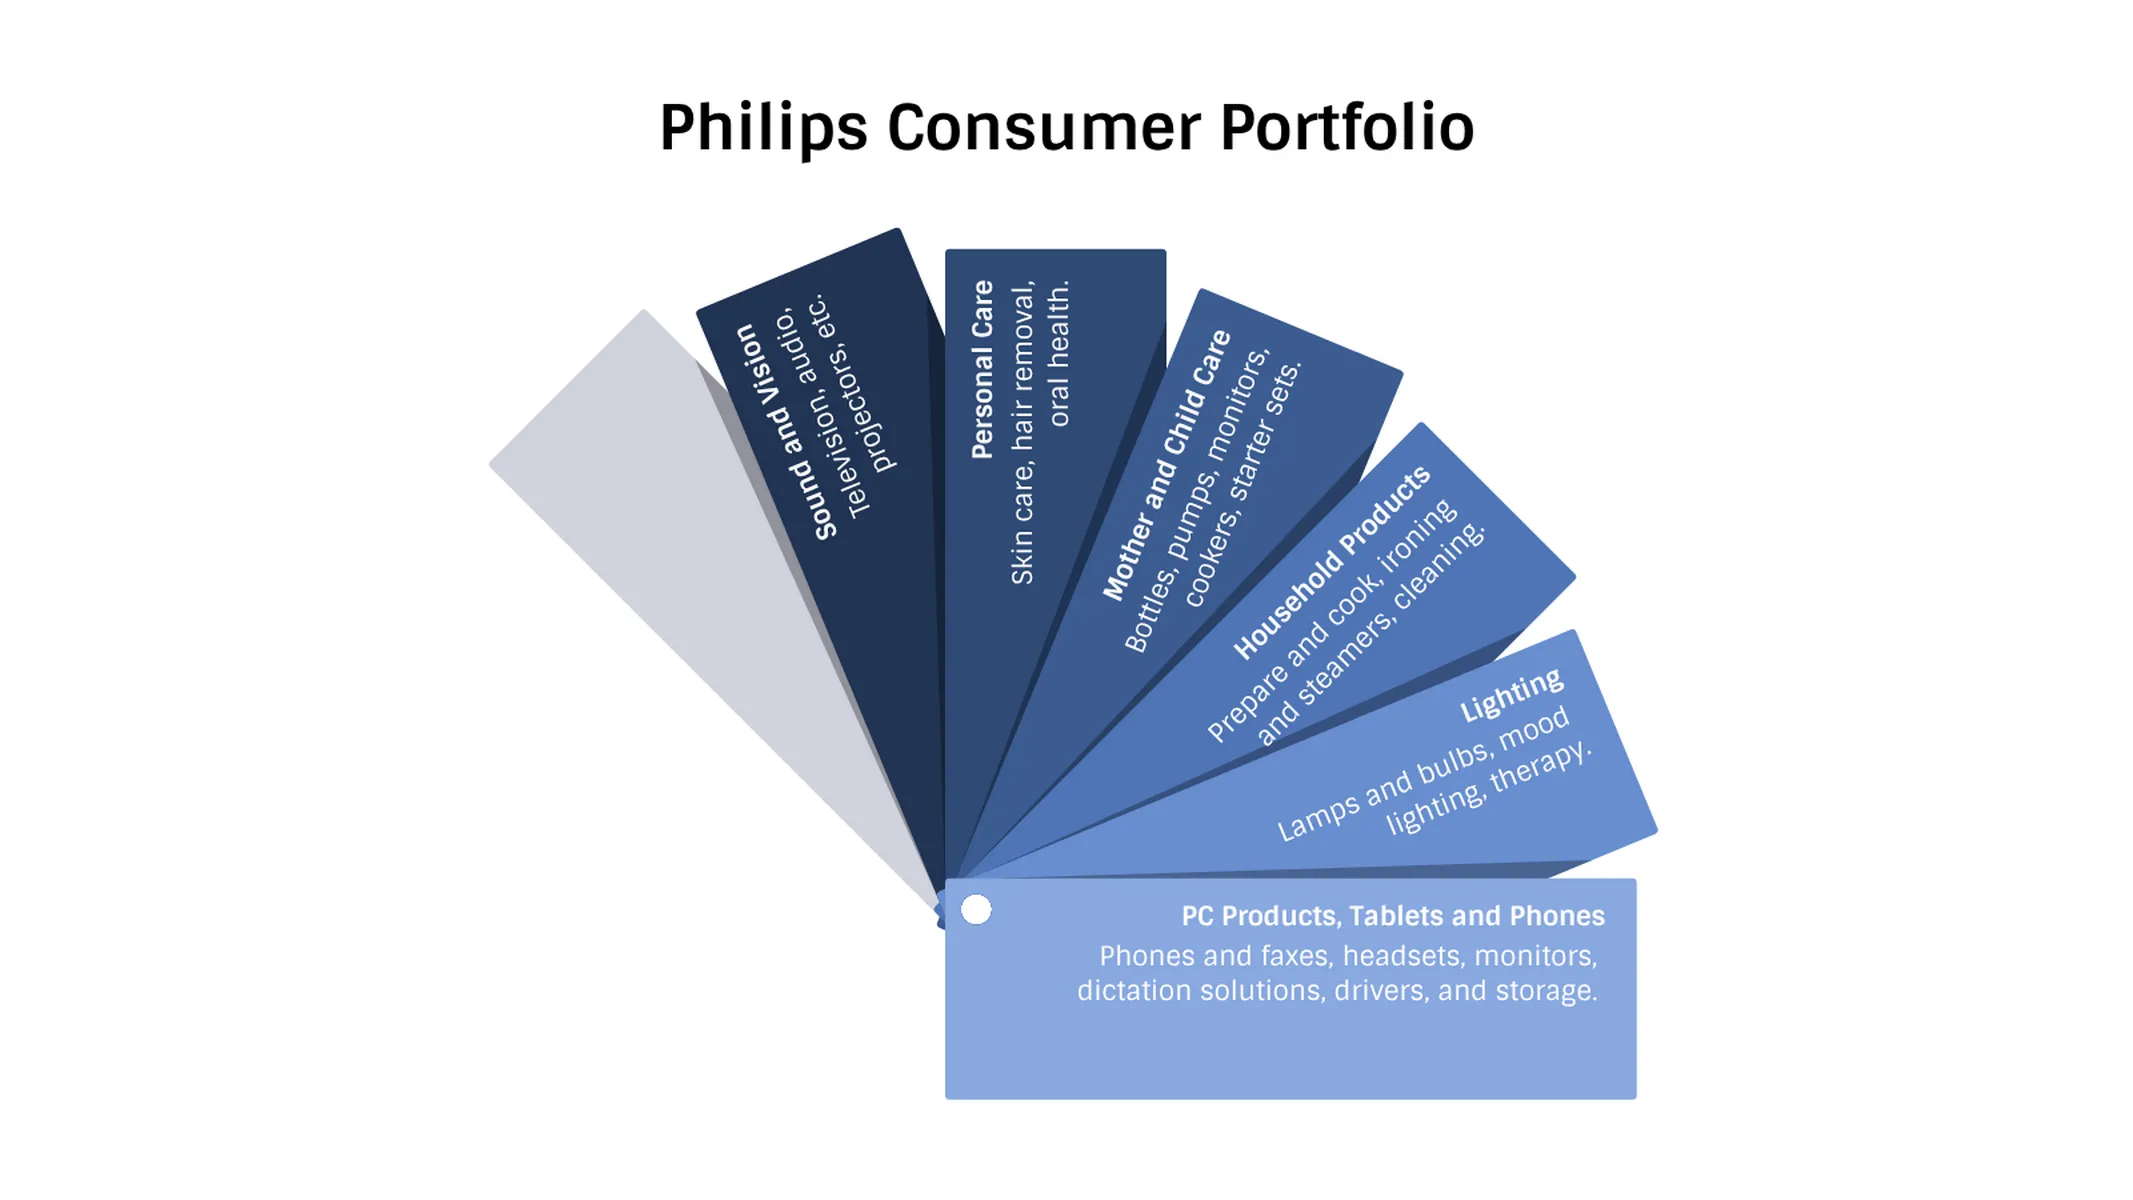
Show your corporate portfolio with this fanned-out color chart.
Create your chart in 3 simple steps
- Create new Color Fan
- Add your data
- Export or share
Why Vizzlo?
- Create professional charts in seconds
- Fully customizable, no design skills needed
- Create directly in PowerPoint & Google Slides
What is a color fan chart?
A color fan chart is a beautiful choice to demonstrate the diversity of your portfolio or the versatility of one of its products. As its name suggests, it has the form of a color fan deck. Use each slide/color to present the products of your palette/catalog or different features of a single product.
This chart is also an excellent solution to visualize a presentation agenda and offer your audience a concise yet striking topic overview.
Pro tip: color code elements of your slide deck according to your color fan—it will help the navigation of the audience throughout your presentation.
How to make a color fan chart with Vizzlo?
Create your color fan in seconds:
- Click on any element to directly edit it.
- Use its respective card in the sidebar as a support to enter your text and change colors.
- For a perfectly designed color palette, choose a Vizzlo theme exploring the settings of the “APPEARANCE” tab.
Color fan chart maker: key features
- Custom colors
- Up to six items
Color Fan: What's new?
Color Fan Alternatives
Enhance your productivity
Create a Color Fan directly in the tools you love

Create a Color Fan in PowerPoint with
Vizzlo's add-in

Loved by professionals around the world


Visualizations your audience won’t forget
Convey abstract concepts and data with professionally designed
charts and graphics you can easily edit and customize.