Chart Vizzard
Vizzlo's AI-based chart generatorFolder Chart
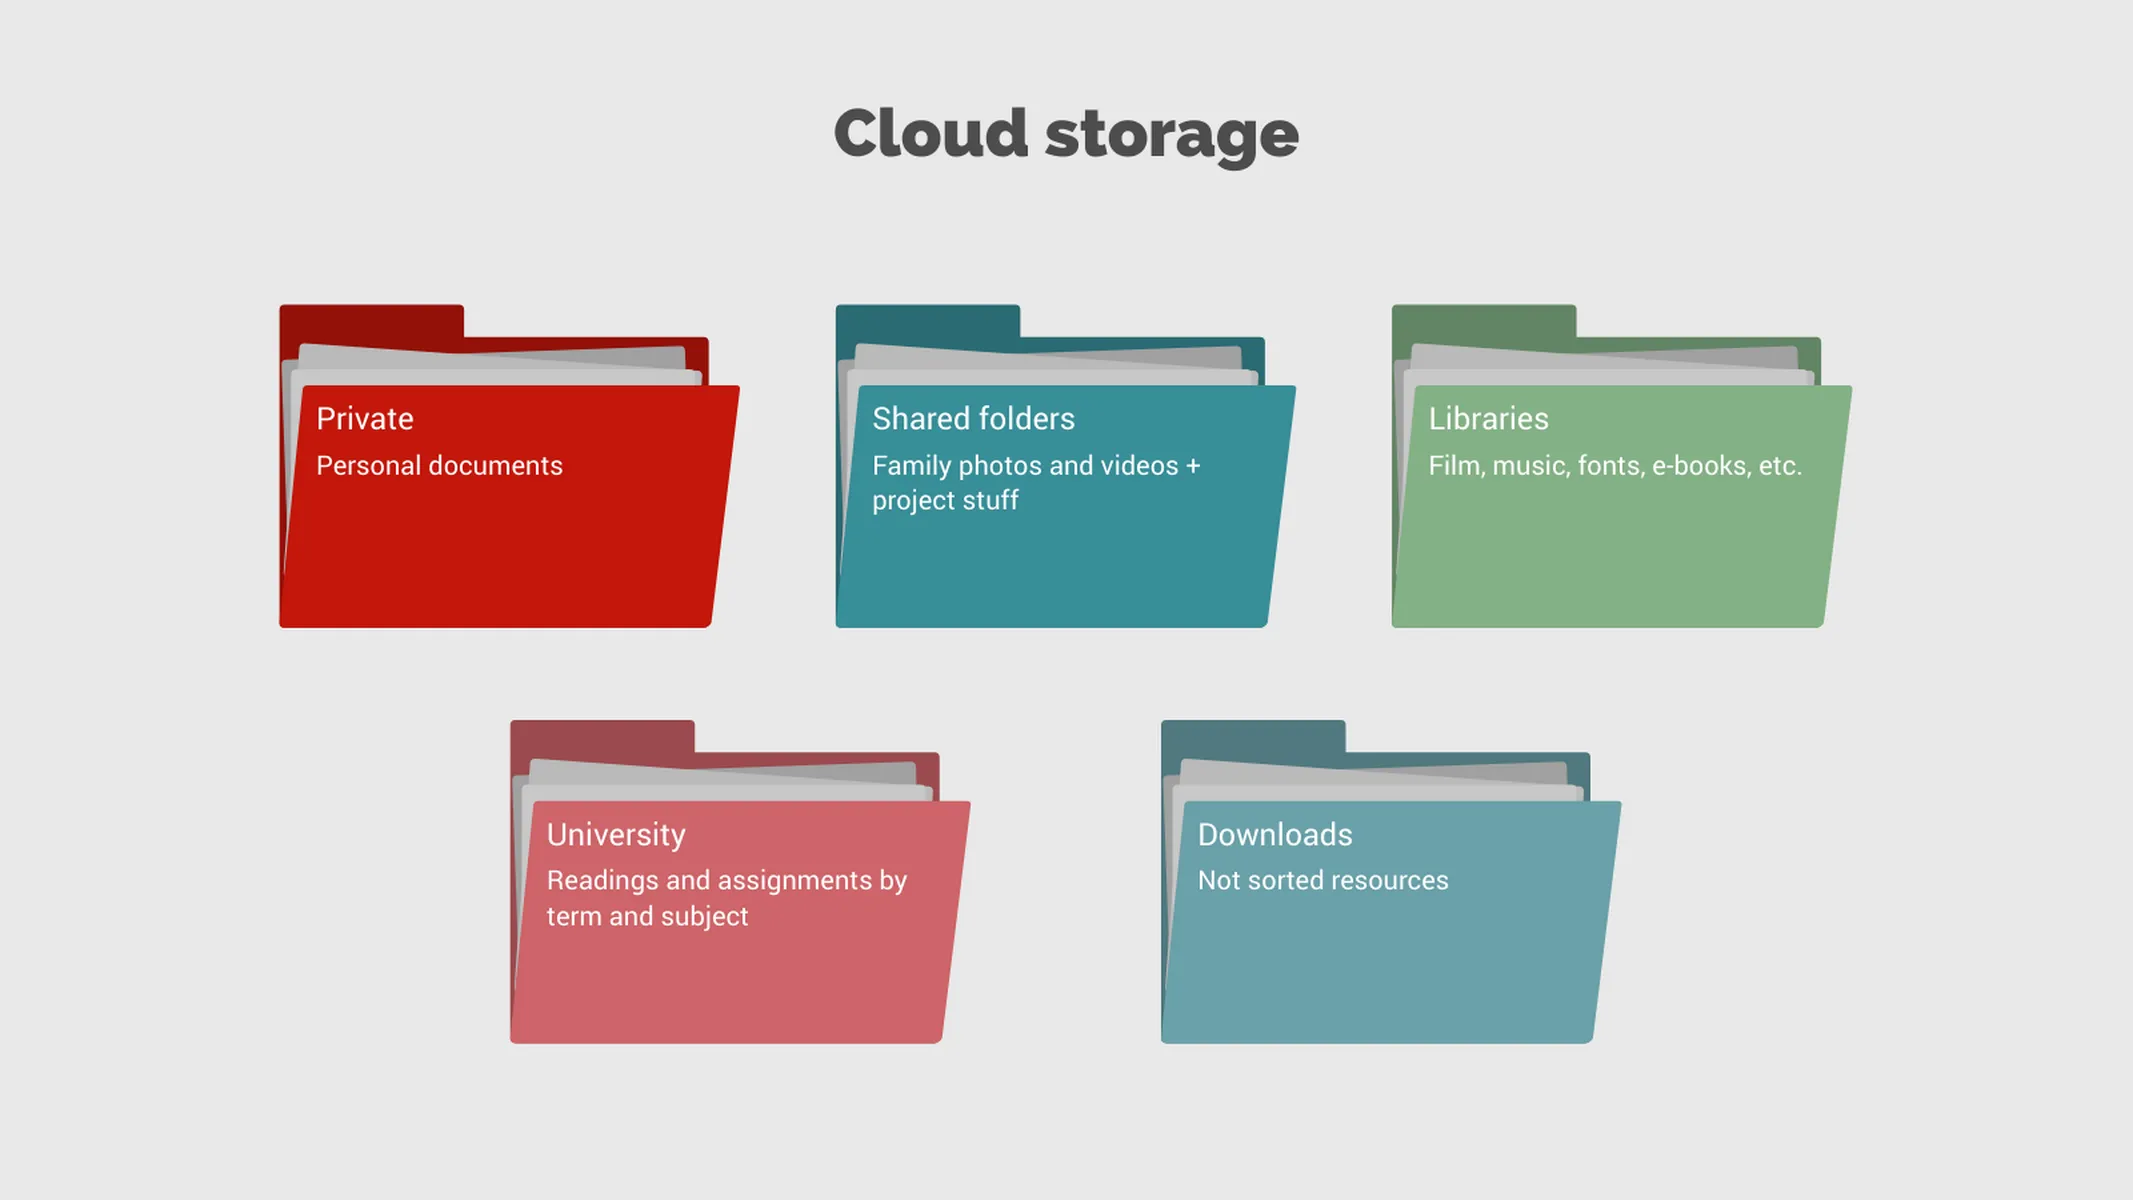
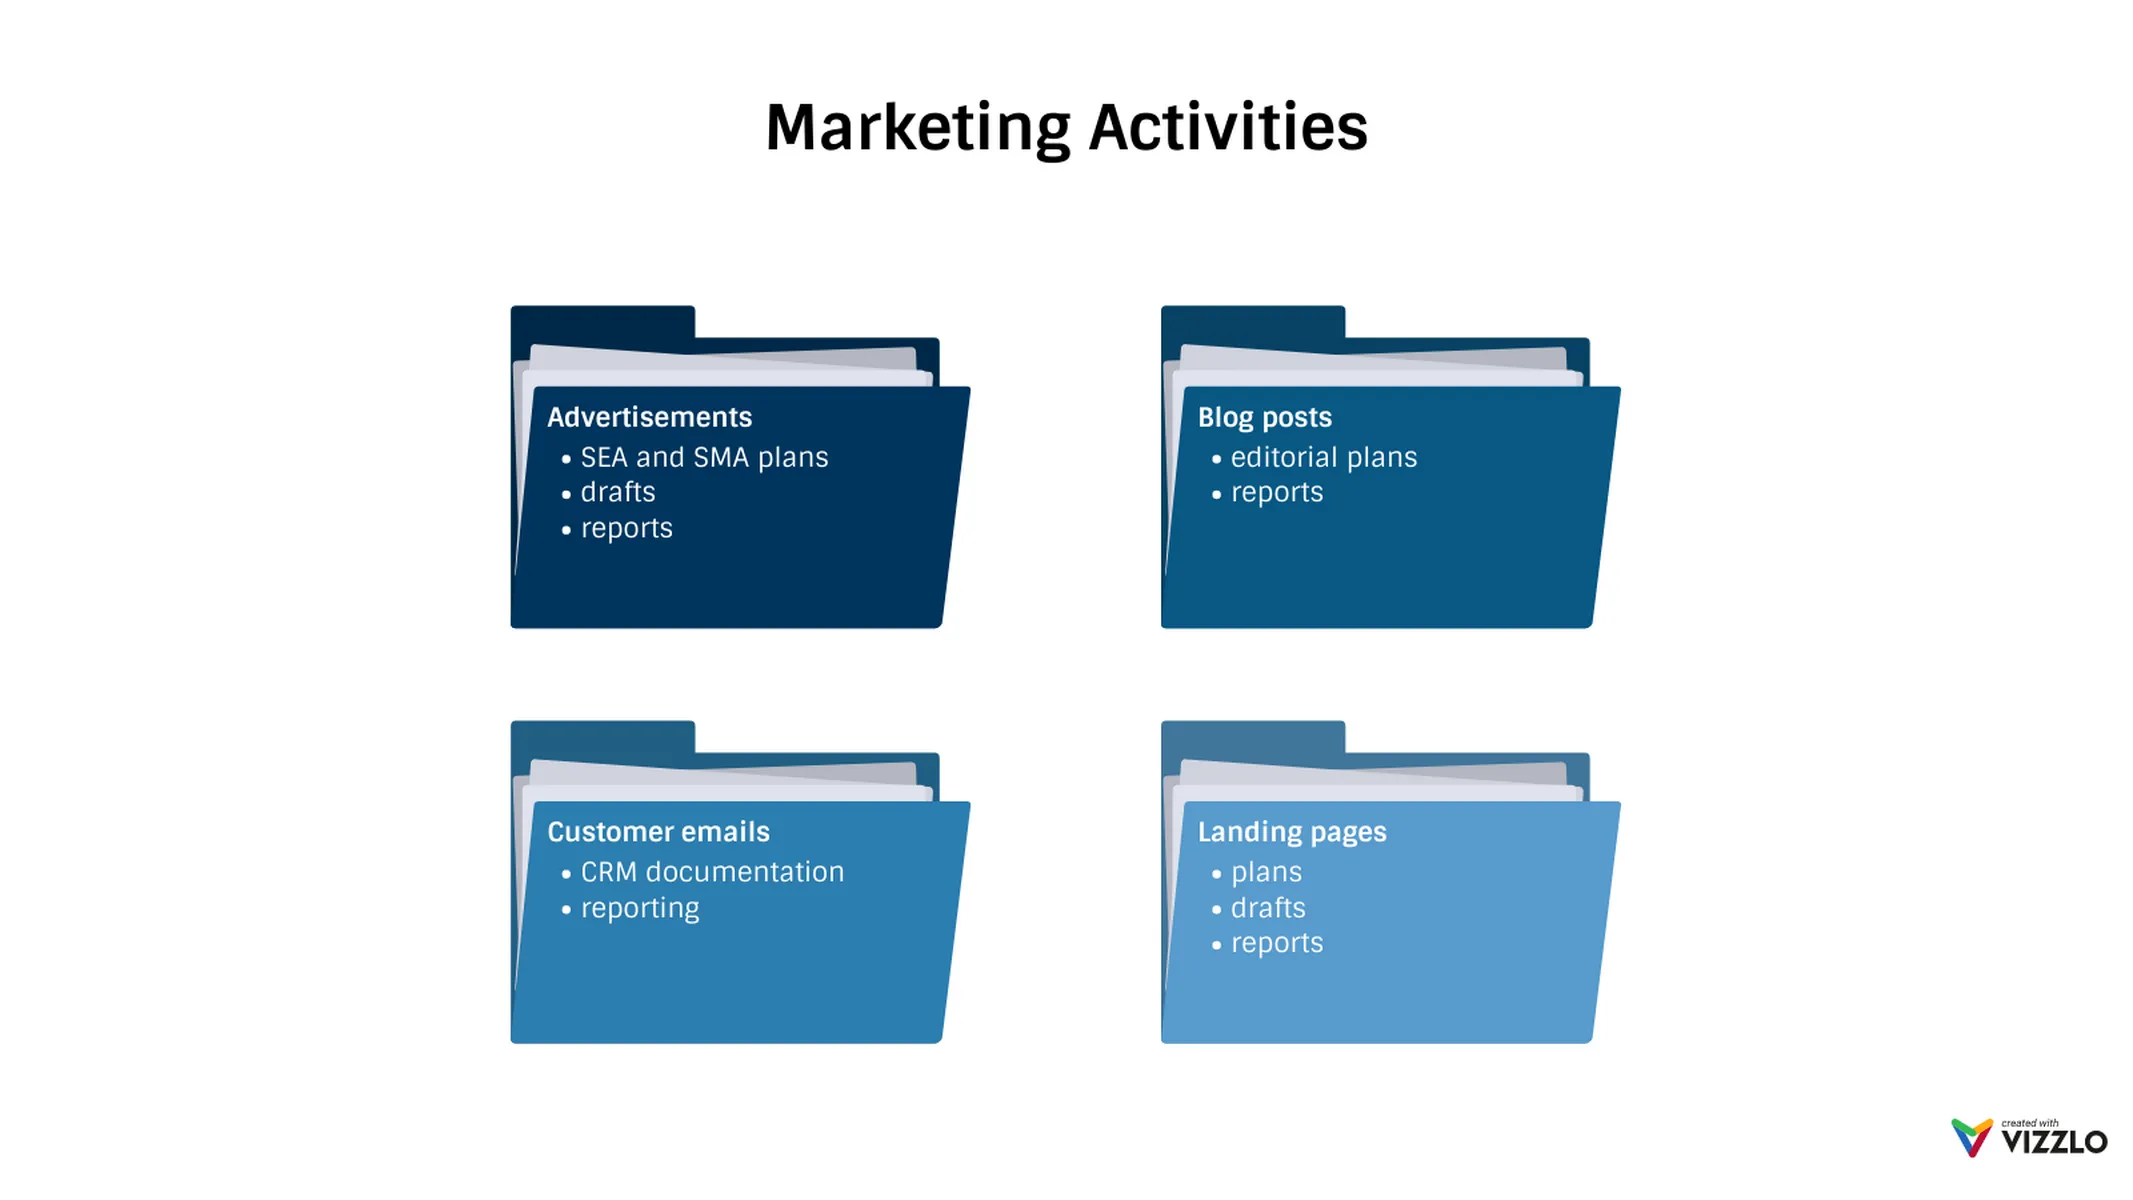
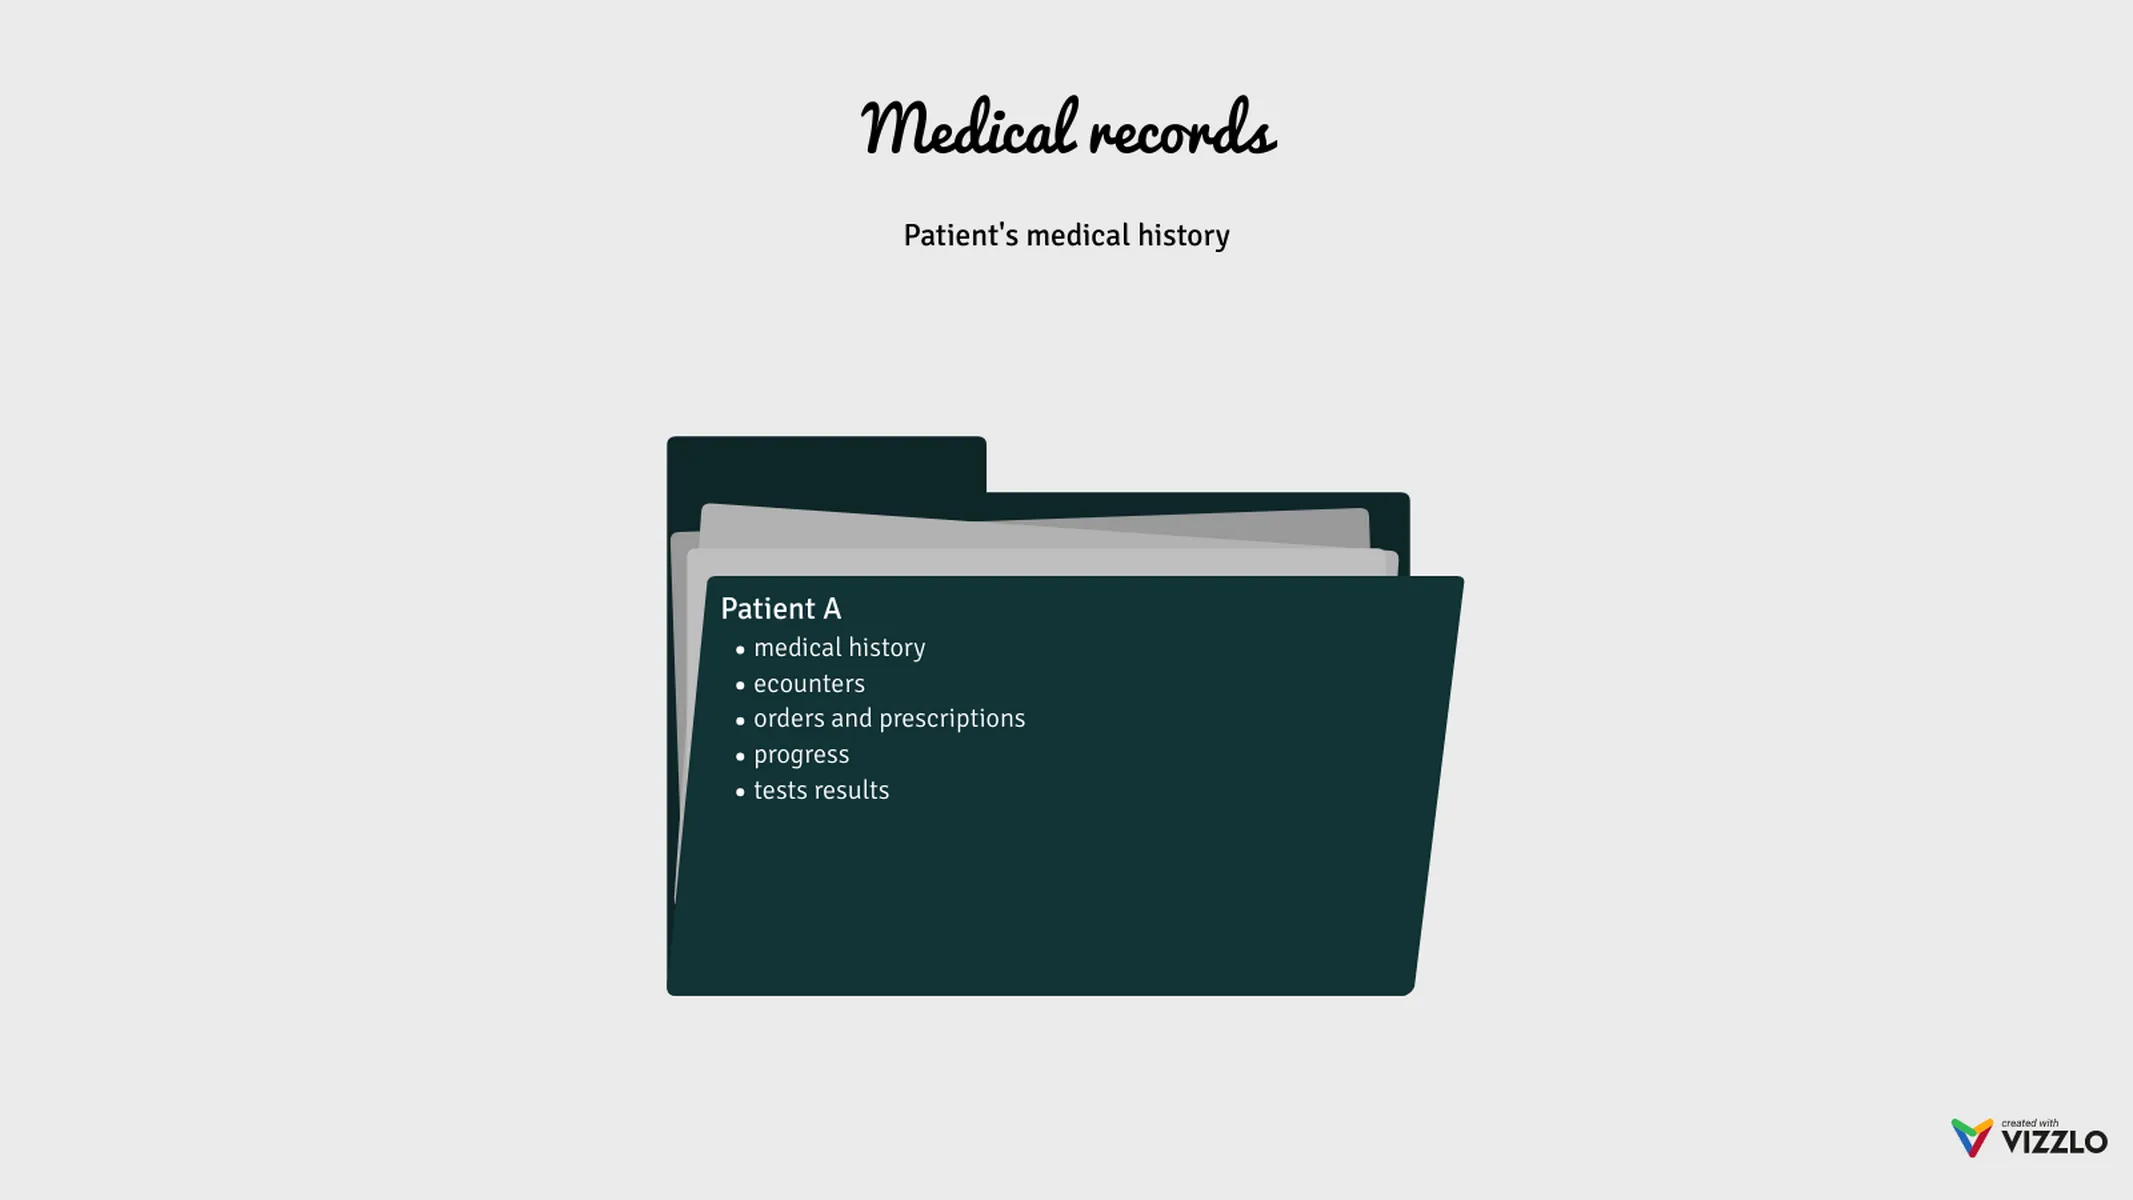
Easily visualize different packages of documents using this folder chart.
What is a folder chart?
A folder chart is an elegant choice to represent the division and organization of files and documents, knowledge, and even work packages visually.
The folders illustration can be taken literally, to visualize packages of documents. But you can also use it to organize and group more abstract concepts, e.g., departments, teams, correlated deliverables, etc.
How to make a folder chart with Vizzlo?
It takes just a few seconds to create your folder chart with Vizzlo. Follow these super easy steps:
- Explore the Vizzlo themes to find your favorite color/font scheme.
- Click on the folders to directly edit them (or use the cards in the sidebar)
- Enter a title and a short description or a bullet list for each folder.
- Drag and drop any folder to reorder it.
Folder chart maker: key features
- Custom colors
- Up to six items
Folder Chart: What's new?
Folder Chart Alternatives
Enhance your productivity
Create a Folder Chart directly in the tools you love

Create a Folder Chart in PowerPoint with
Vizzlo's add-in
Loved by professionals around the world


Visualizations your audience won’t forget
Convey abstract concepts and data with professionally designed
charts and graphics you can easily edit and customize.


