PREVIEW
Chart Vizzard
Vizzlo's AI-based chart generator
Graphs
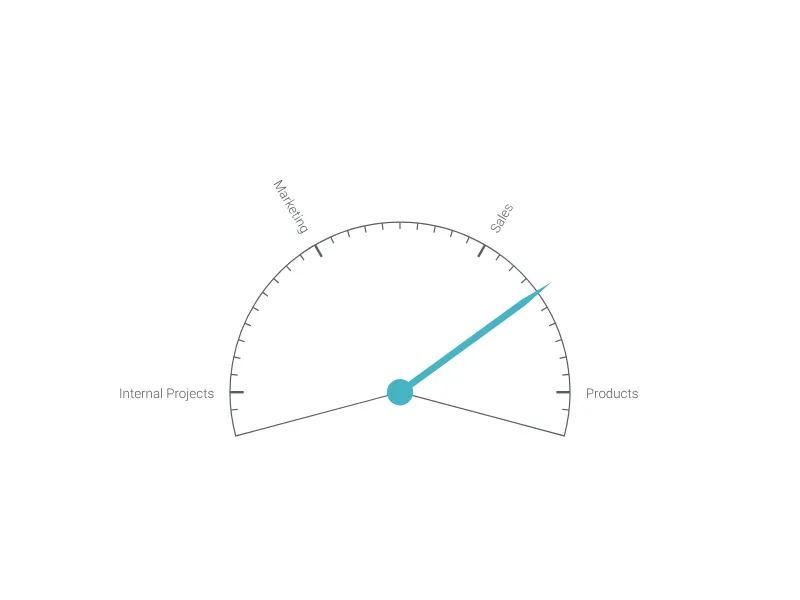
Control Knob Chart
Control Knob Chart
Present the different steps of your project with a flippable adjusting wheel.
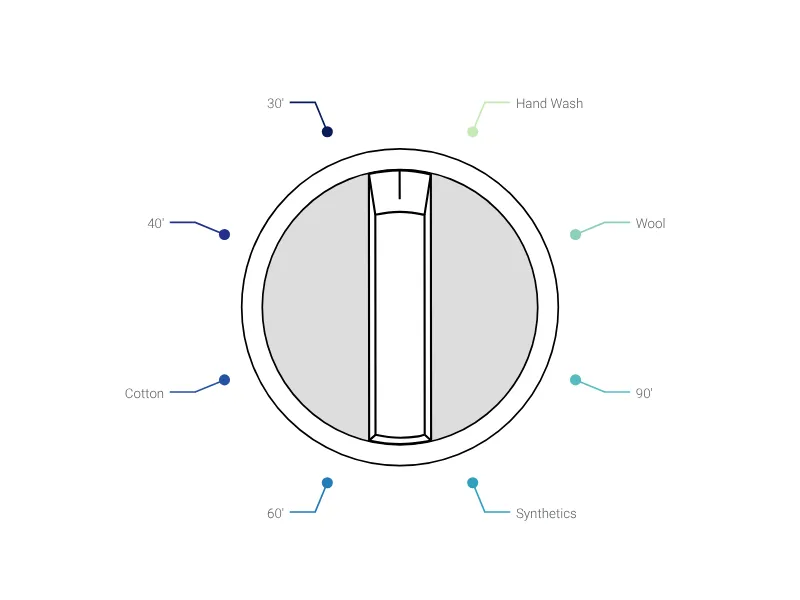
Represent your actual project step with this knob control.
This knob control allows visualizing a project’s actual state in a simple way. Click and drag the pointer or move the slider to change the knob position.
Control Knob Chart: What's new?
Jul 15, 2025
Reworked as more interactive and to support custom page setups seamlessly.
Read more in our Changelog.
Control Knob Chart Alternatives
Enhance your productivity
Create a Control Knob Chart directly in the tools you love

Create a Control Knob Chart in PowerPoint with
Vizzlo's add-in

Loved by professionals around the world


Visualizations your audience won’t forget
Convey abstract concepts and data with professionally designed
charts and graphics you can easily edit and customize.