Chart Vizzard
Vizzlo's AI-based chart generatorCycle Diagram
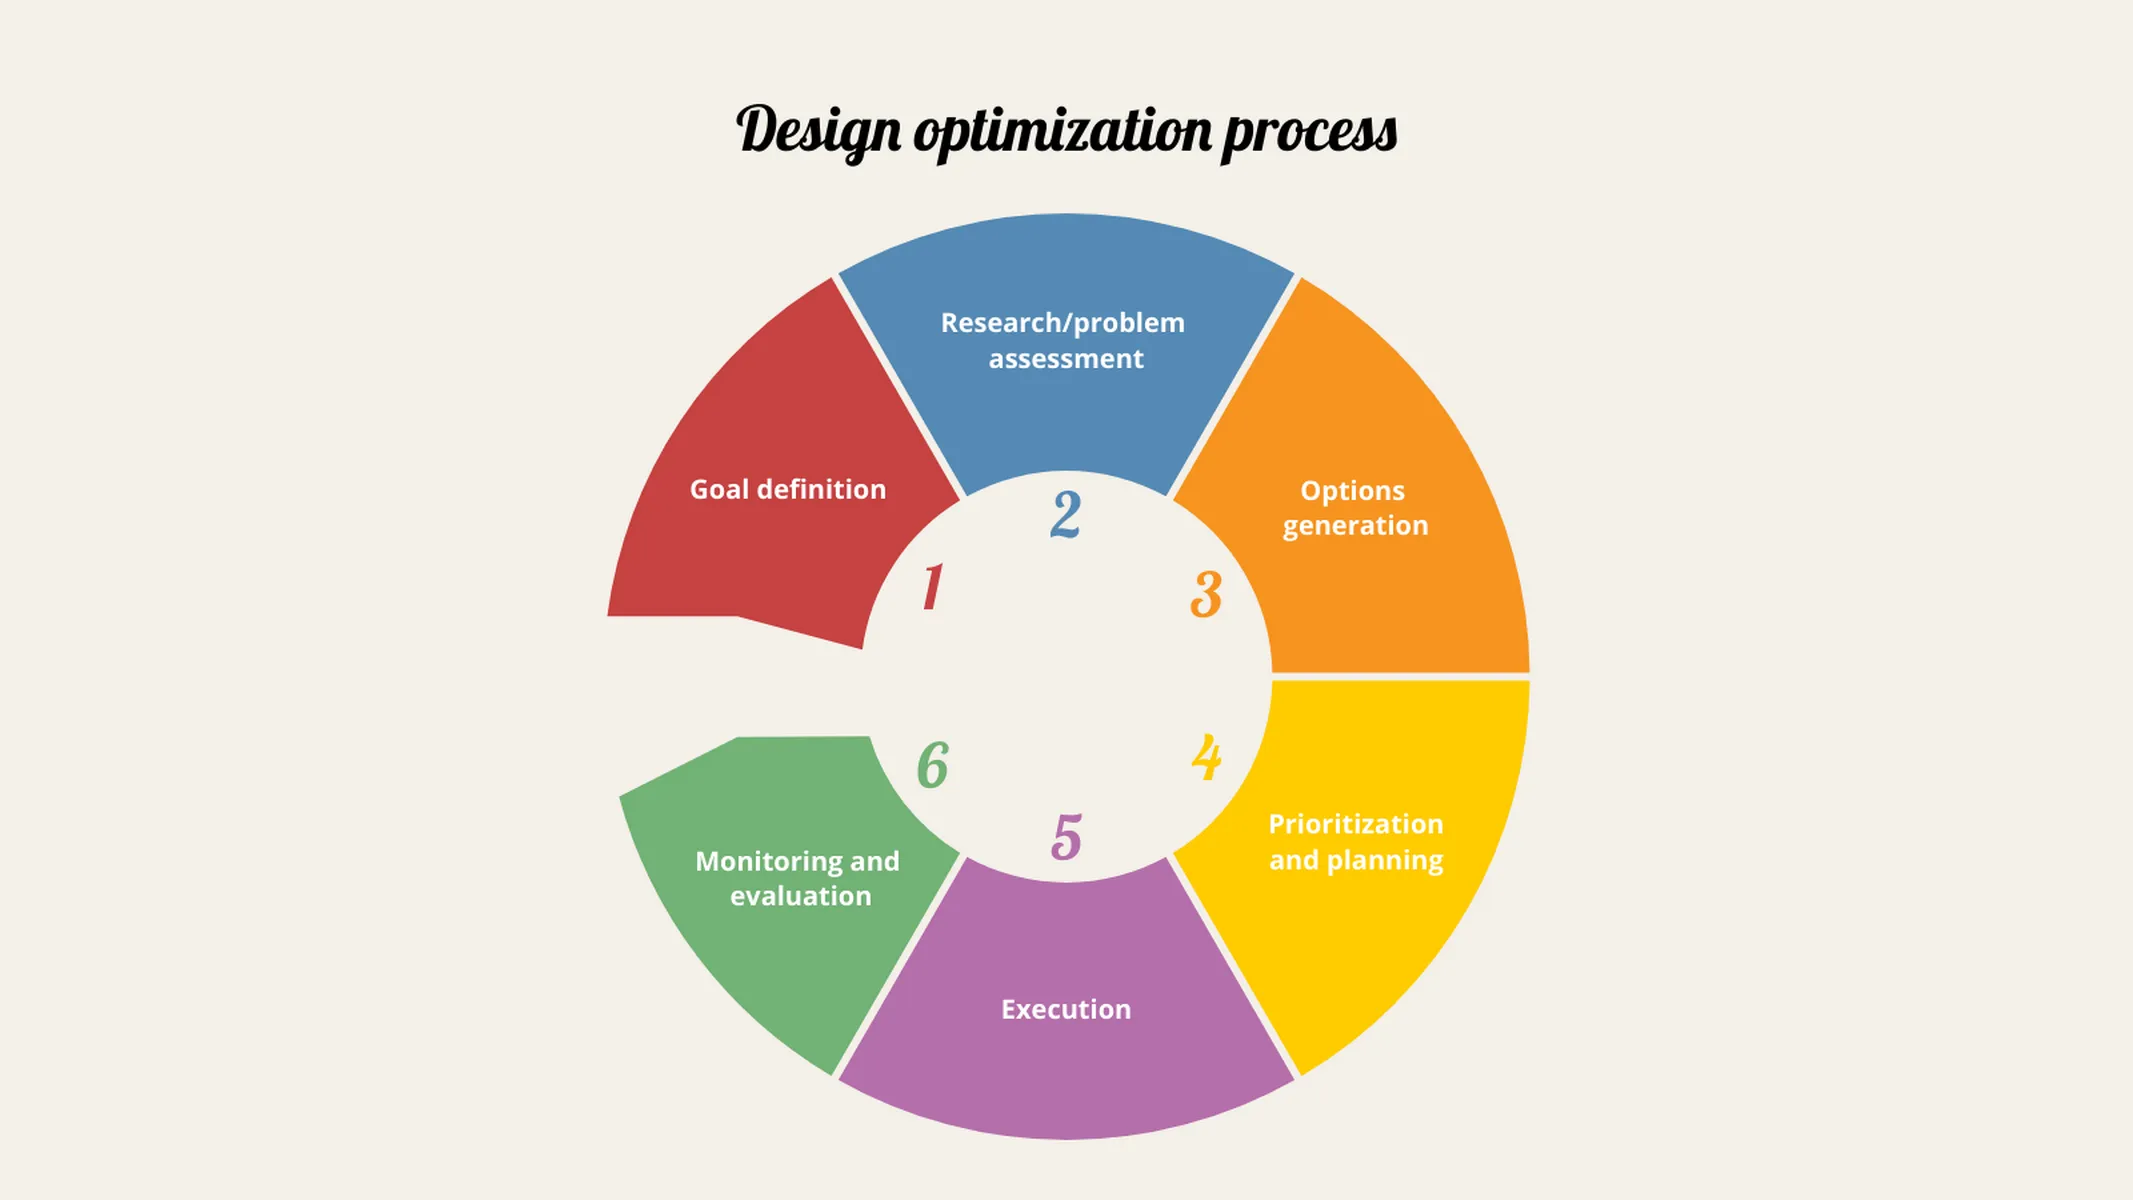
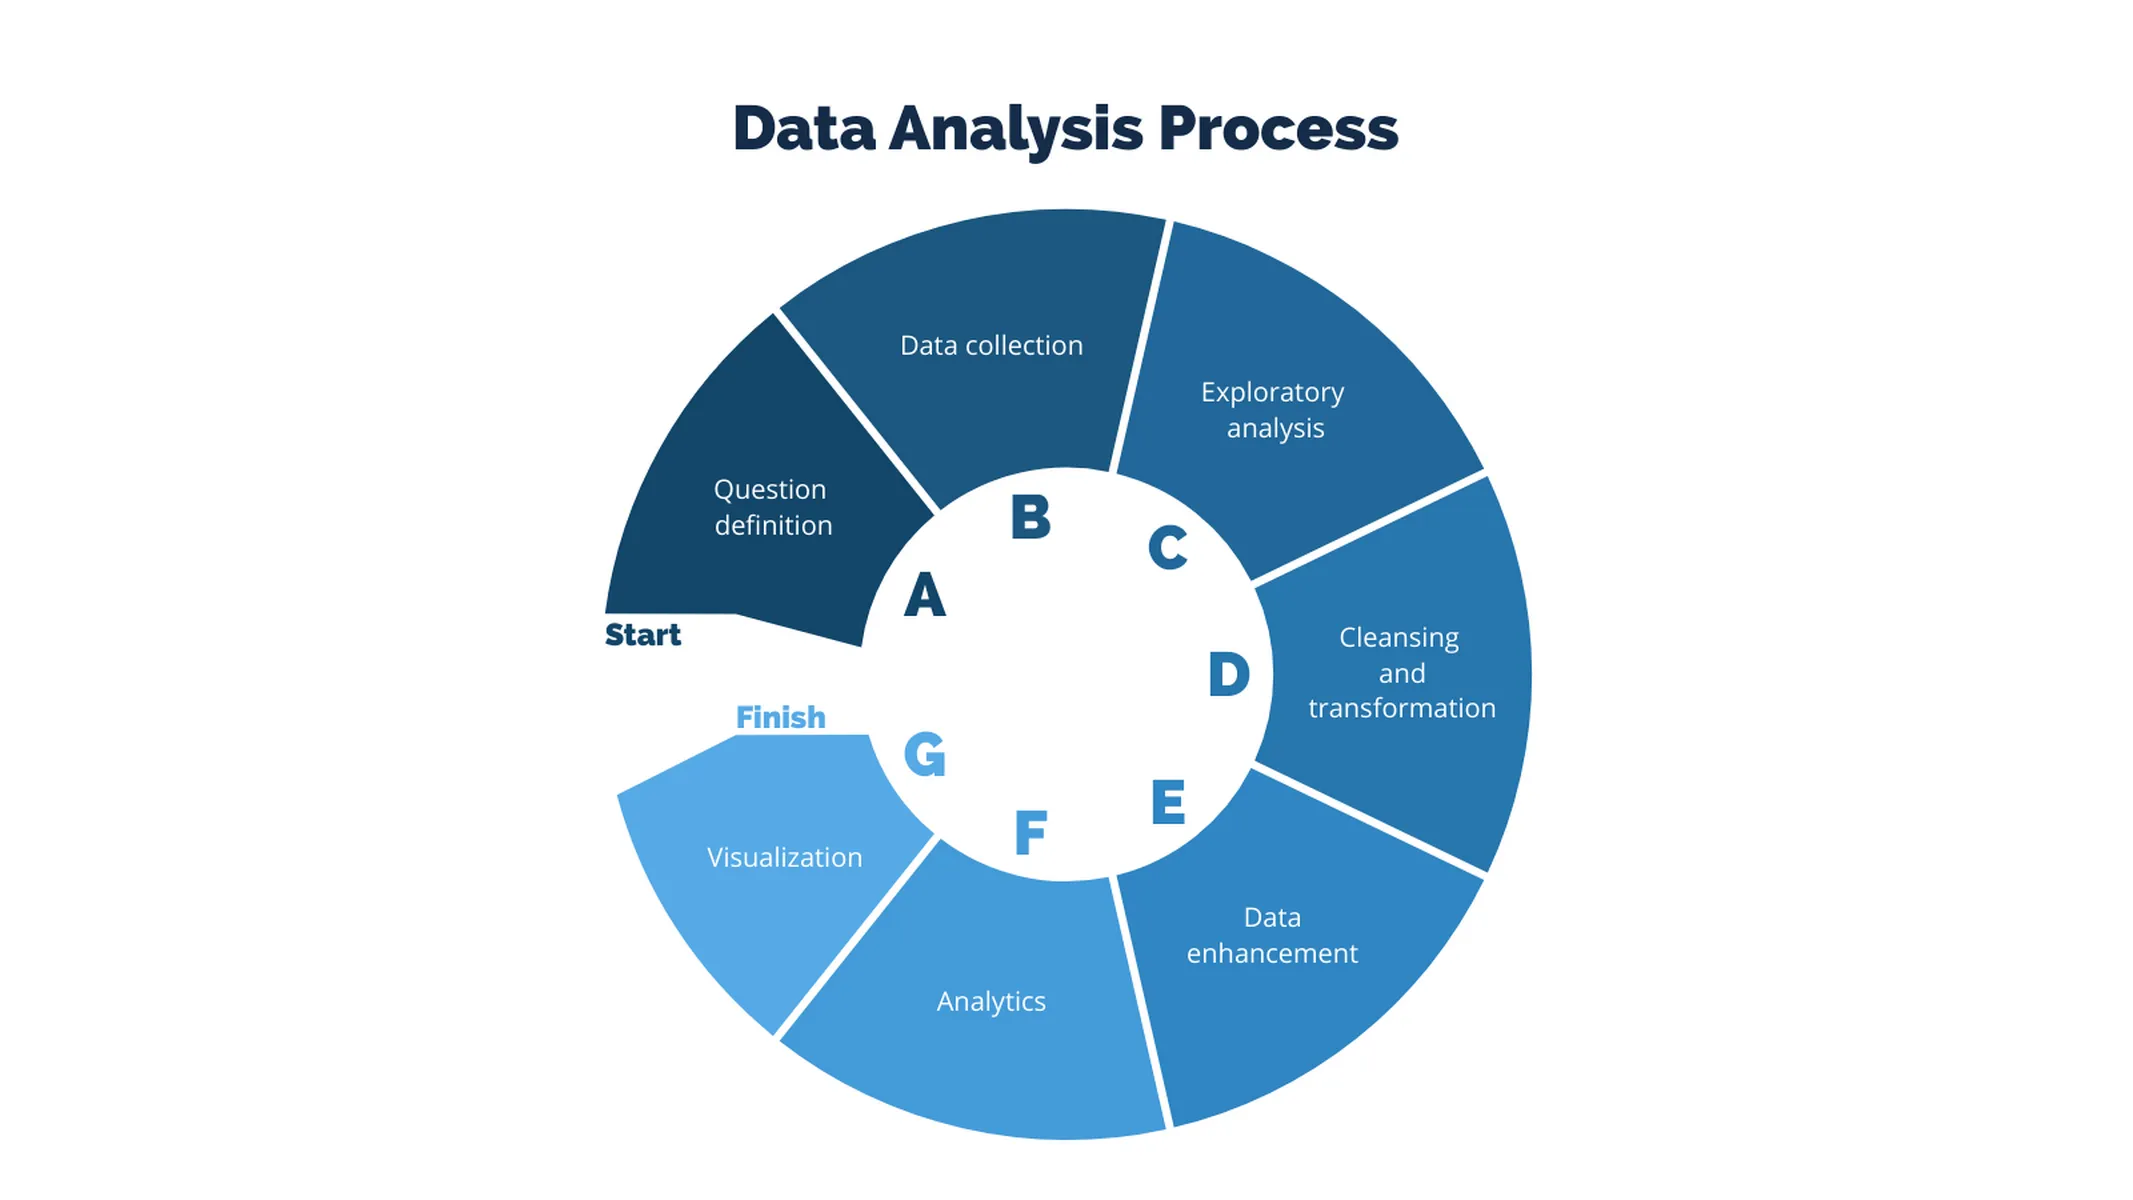
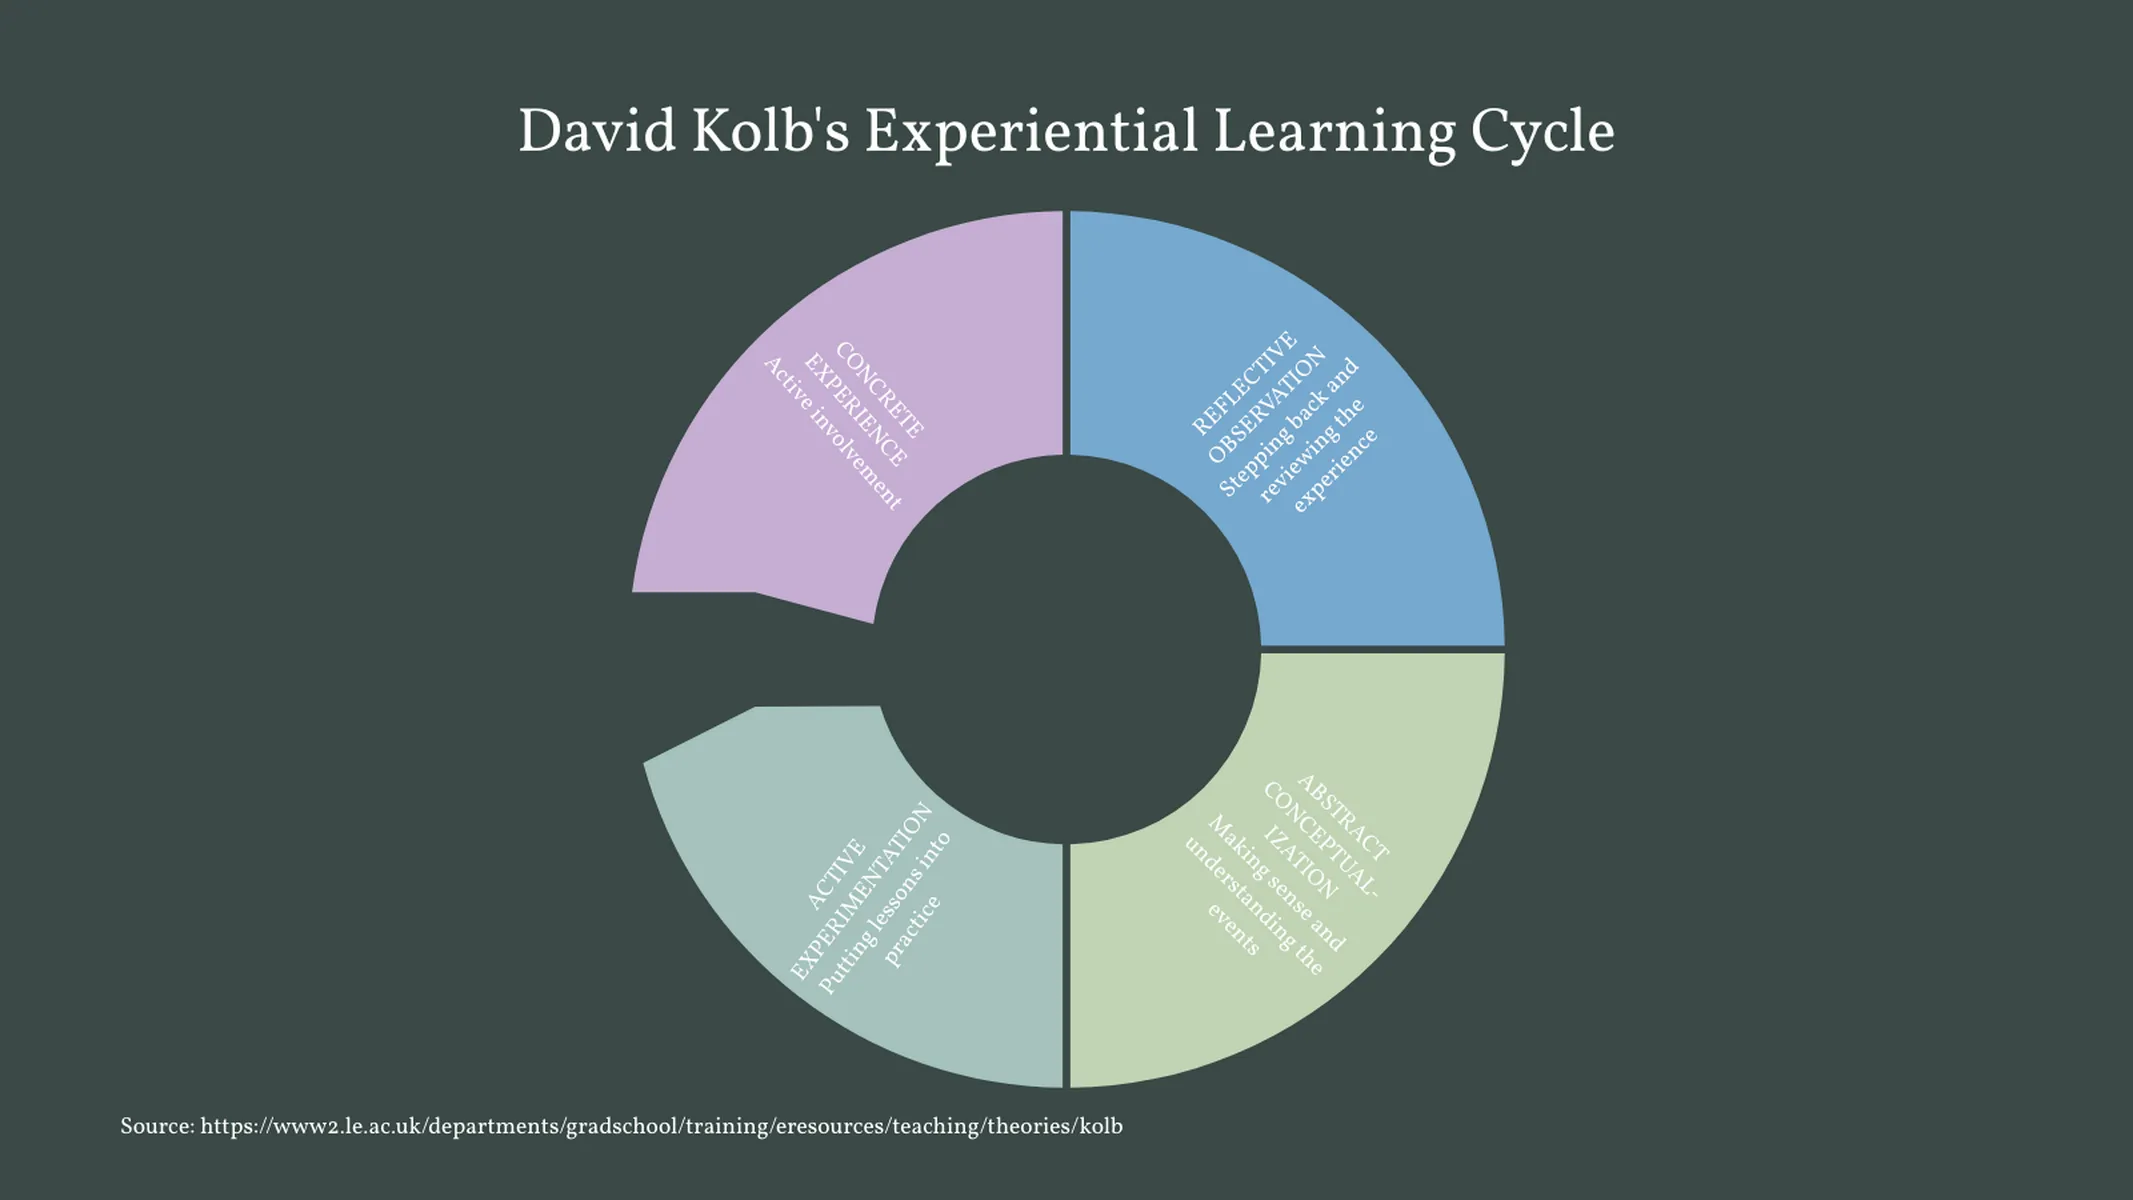
A circular chart for milestones or recurring processes with up to ten stages.
What is a cycle diagram?
A cycle diagram is a circular chart that illustrates a series of actions or steps that flow to another. Each of its pieces represents a different phase of a cyclic process.
You can use it to represent any process whose output returns repeatedly modifying/influencing the new cycle. From natural processes, like the water cycle and the seasons, to human-made ones, like the methodologies for idea generation, performance optimization and problem-solving, this chart is ideal to visualize the relationships of the cycle phases and to emphasize the notion of a closed chain of self-reinforcing developments.
How to make a cycle diagram with Vizzlo?
Create a beautiful cycle diagram in seconds! Follow these easy steps:
- Click on the pieces to edit them. You can also use their active cards in the sidebar or the spreadsheet as support to enter your content.
- In the tab “APPEARANCE” of the sidebar, you can choose your favorite theme or customize one.
- Explore the other options of this tab to refine the look of your chart: pick number or letters to enumerate your phases, define the labels of your points of departure and arrival, and choose to rotate or not your text.
Cycle diagram maker: key features
- Custom colors
- Different enumeration styles: numbers, letters, and none
- Up to ten phases
Cycle Diagram: What's new?
Cycle Diagram Alternatives
Enhance your productivity
Create a Cycle Diagram directly in the tools you love

Create a Cycle Diagram in PowerPoint with
Vizzlo's add-in
Loved by professionals around the world


Visualizations your audience won’t forget
Convey abstract concepts and data with professionally designed
charts and graphics you can easily edit and customize.
